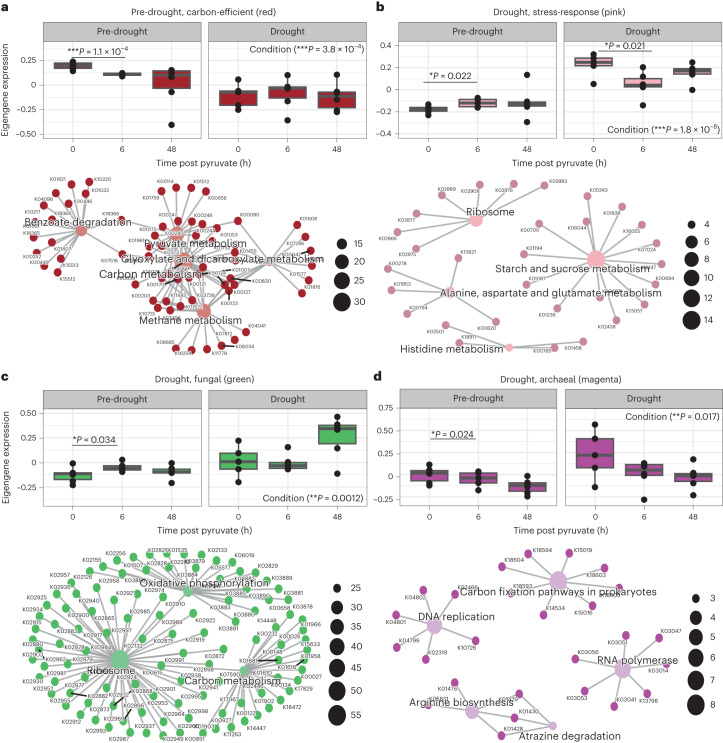
Fig. 4. Expression of pre-drought and drought-associated gene modules and their networks of enriched KEGG metabolic pathways.
a–d, Top: eigengene expression at 0, 6 and 48 h post pyruvate addition during pre-drought (0 and 48 h (n = 6), 6 h (n = 5)) and drought (6 and 48 h (n = 6), 0 h (n = 5)) conditions for the subset of modules: carbon-efficient, red (a); stress-response, pink (b); fungal, green (c) and archaeal, magenta (d). Expression values are arbitrary units. Each point represents one sample; boxes represent Q1–Q3 with centre line indicating median, and bars extend to maximum and minimum values, excluding outliers. Bottom: metabolic network of enriched KEGG pathways within the indicated module. Central nodes represent the pathway and each branch represents the KO group within that pathway. P values in a–d are from linear mixed effects models between pre-drought and drought (as indicated after ‘Condition’) or 6 or 48 h vs 0 h (as indicated by lines between timepoints); *P < 0.05, **P < 0.01, ***P < 0.001.

