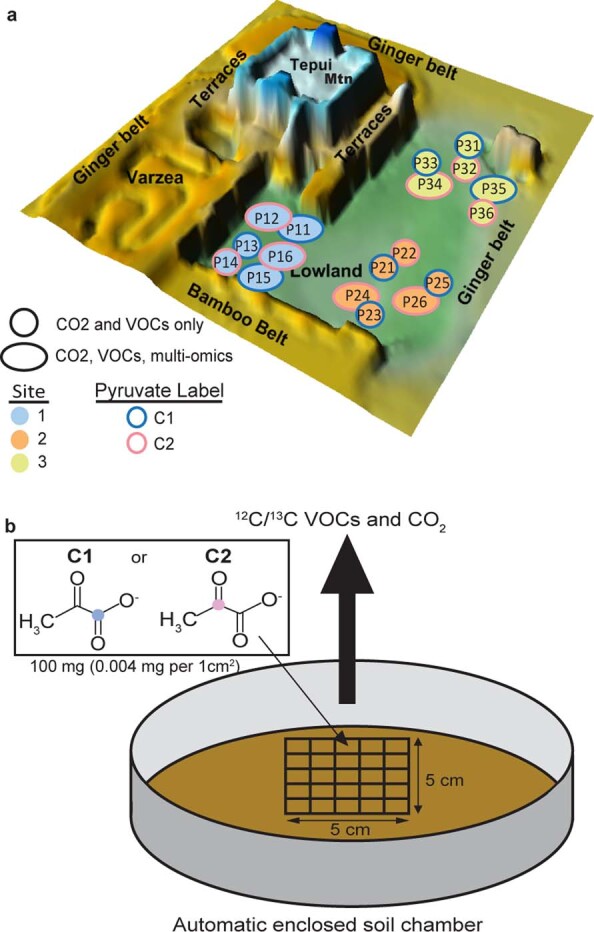
Extended Data Fig. 1. Soil chamber locations and experimental setup.

a) Topological map of Biosphere 2 Tropical Rainforest, with locations of Sites 1 − 3. All circles represent collar locations where CO2 and VOC data were collected and large circles represent a sub selection of sites collars where additional soil samples were collected for metatranscriptomics, metagenomics, and metabolomics. b) Diagram showing soil pyruvate experimental setup with stencil placed inside a soil collar where 13C1- or 13C2-pyruvate was added within each 1 cm×1 cm square. An automatic soil chamber was placed over the soil collar during the experiment and continuous measurements of 12C and 13C-CO2 and VOCs were measured.
