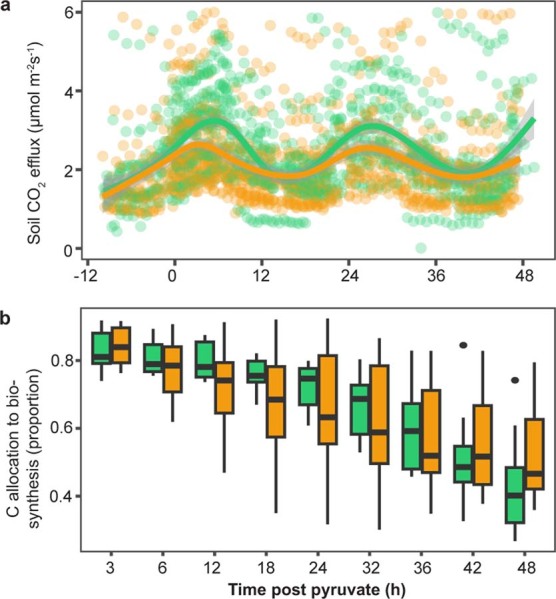
Extended Data Fig. 2. Continuous CO2 emissions and proportion of C from pyruvate allocated to biosynthesis.

a) Total flux of CO2 during pre-drought and drought conditions. Each point represents a single measurement per soil chamber (~ 64 measurements), of which there were 3 replicates each that were injected with either 13C1- or 13C2-pyruvate for each site (total n = 18 each for pre-drought and drought), and lines show the data smoothed with the surrounding shaded area showing ± SEM. B) Proportion of C from pyruvate allocated to biosynthesis. This was calculated as 13C-CO2-C1/ (13C-CO2-C1 + 13C-CO2-C2) on each set of C1/C2 chambers per site (n = 9 each for pre-drought and drought) with continuous emission data binned to 3 or 6 h intervals, from 0 to 48 h post pyruvate injection. (n = 9 each for pre-drought and drought). Boxes represent Q1 - Q3 with center line indicating median, and bars extending to maximum and minimum values, excluding outliers.
