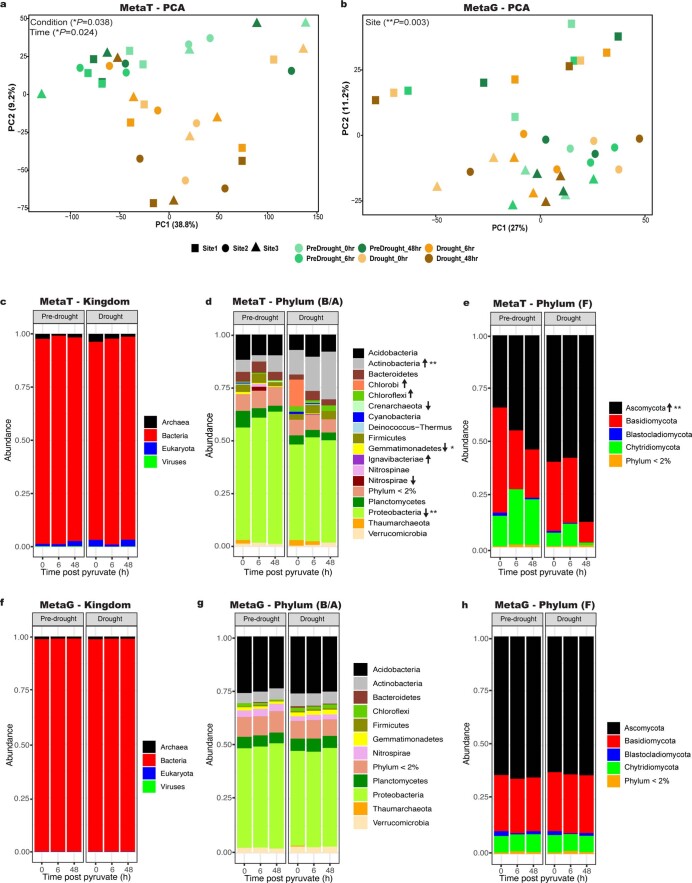
Extended Data Fig. 4. Metatranscriptomic and metagenomic functional and taxonomic diversity shows shifts in active microbial functional profiles and taxonomic diversity, but not in functional potential and total (active and inactive) taxonomic diversity.
PCA of (a) metatranscriptomic and (b) metagenomics data. Taxonomic profiles as inferred from metatranscriptomics data at the (c) kingdom-level for active archaea, bacteria, eukaryota, and viruses, d) phylum-level for bacteria and archaea, and e) phylum-level for fungi. Taxonomic profiles as inferred from metagenomics data at the f) kingdom-level for total archaea, bacteria, eukaryota, and viruses, g) phylum-level for bacteria and archaea, and h) phylum-level for fungi. For taxonomic profiles, arrows indicate direction of changes in relative abundance (up for increased, and down for decreased relative abundance in drought compared to pre-drought conditions). Arrows with no stars means the phylum was present in one condition (pre-drought or drought) and absent in the other condition. For panels a-b, P-values were determined using PERMANOVA on Bray-Curtis distance matrices. For panels c-h, P-values were determined using Linear Mixed Effect Models. *, P < 0.05; **, P < 0.01; (exact P-values: P = 0.010 [Proteobacteria], P = 0.016 [Gemmatimonadetes], P = 0.0012 [Actinobacteria] (panel b), P = 0.0050 [Ascomycota] (panel c)). metaT, metatranscriptomics; metaG, metagenomics; B, bacteria; A, archaea; F, fungi.

