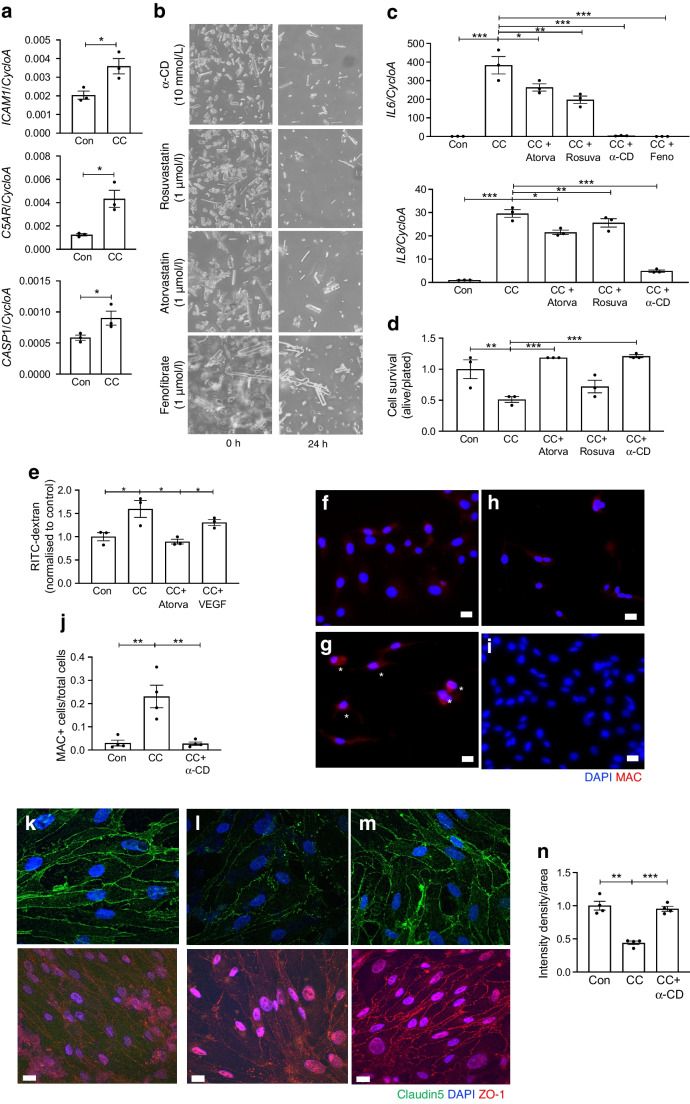
Fig. 3.
CC-induced inflammation, cell death and breakdown of the BRB. HREC (a–j) or BREC (k–n) were treated with CC (2 mg/ml) or crystals pre-treated for 1 h with atorvastatin (1 μmol/l), rosuvastatin (1 μmol/l), fenofibrate (1 μmol/l) or α-CD (10 mmol/l). (a) As determined by quantitative RT-PCR, CC treatment results in elevated ICAM1, C5AR1 and CASP1 mRNA expression. Cyclophilin A (CycloA; also known as PPIA) was used as a housekeeper. (b) Ex vivo images of CC before (0 h) and after (24 h) administration of the cholesterol-dissolving drugs. (c) After 24 h, IL6 and IL8 mRNA expression was measured. (d) Effect of atorvastatin and VEGF on CC-induced increase in permeability to RITC-dextran. (e) Cell death as measured by the trypan blue exclusion assay. (f, g) The MAC (red) is activated in CC-treated HREC cells (g) when compared with control cells (f). MAC-positive cells are indicated by asterisks. (h) Treatment with α-CD (10 μmol/l) prevents MAC formation in HREC. (i) Control cells treated with α-CD. (j) Number of MAC-positive cells under the various treatments. (k–m) Treatment with α-CD (10 mmol/l) prevented CC-induced border disruption in BREC: claudin-5 (green) and ZO-1 (red) staining in control cells (k), cells treated with CC (l) and cells treated with α-CD plus CC. (n) Quantification of staining intensity. n=3–4 biological replicates per group. Data were analysed by one-way ANOVA followed by Dunnett’s multiple comparison test (c, d, e, j, n) or two-tailed, unpaired Student's t test (a), *p<0.05, **p<0.01, ***p<0.001. Scale bars, 10 µm. Atorva, atorvastatin; Con, control; Feno, fenofibrate; Rosuva, rosuvastatin

