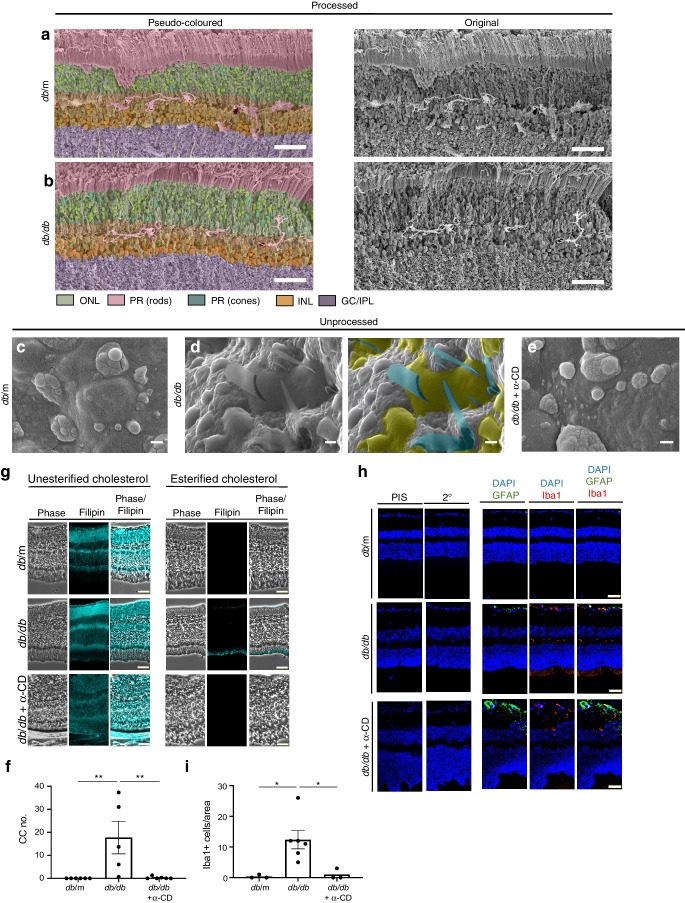
Fig. 5.
α-CD dissolves CCs and reduces Iba1 content in vivo. Representative pseudo-coloured and non-coloured processed SEM images for control mice (a) and 6-month-old diabetic (db/db) mice (b). Unprocessed SEM images for db/m mice (c), db/db mice after 6 months of diabetes (d) and db/db after 6 months of diabetes treated with α-CD (0.4 kg/ml) (e). α-CD was administered orally within the feeding water after 4 months of diabetes for two months. The right-hand image in (d) is a pseudo-coloured image highlighting CCs (teal) and lipid pools (olive) in unprocessed SEM of db/db retinas. (f) Quantification of the number of CCs; n=5–6 animals per group. (g) Phase and filipin staining of db/m, db/db and db/db + α-CD retinas. (h) Pre-immune serum (PIS), secondary antibody only control (2°), glial fibrillary acidic protein (GFAP) (green), Iba1 (red) and DAPI (blue) staining in db/m, db/db and db/db α-CD retinas. (i) Quantification of Iba1-positive cells; n=3–5 animals per group. Data were analysed by One-Way ANOVA followed by Dunnett’s multiple comparison test, *p<0.05, **p<0.01. Scale bars, 50 µm (a, b), 5 µm (c–e) or 50 µm (g, h). GC/IPL, ganglion cell inner plexiform layer; INL, inner nuclear layer; ONL, outer nuclear layer; PR, photoreceptors

