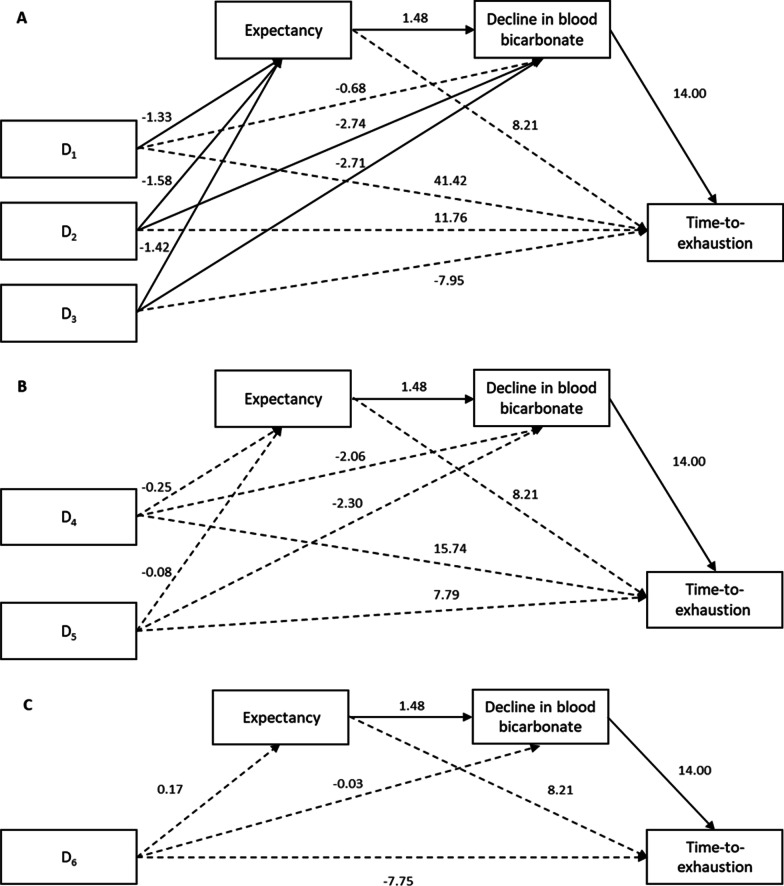
Fig. 2.
A–C The effects of treatment on TTE and the mediating role of expectancy and decline in blood bicarbonate. Note: Values presented are the unstandardised regression coefficients. A solid line represents a significant relationship. A Reference group = SB-SOL. D1 = SB-SOL versus SB-CAP, D2 = SB-SOL versus PL-SOL, D3 = SB-SOL versus PL-CAP. B Reference group = SB-CAP. D4 = SB-CAP versus PL-SOL, D5 = SB-CAP versus PL-CAP. C Reference group = PL-SOL. D6 = PL-SOL versus PL-CAP

