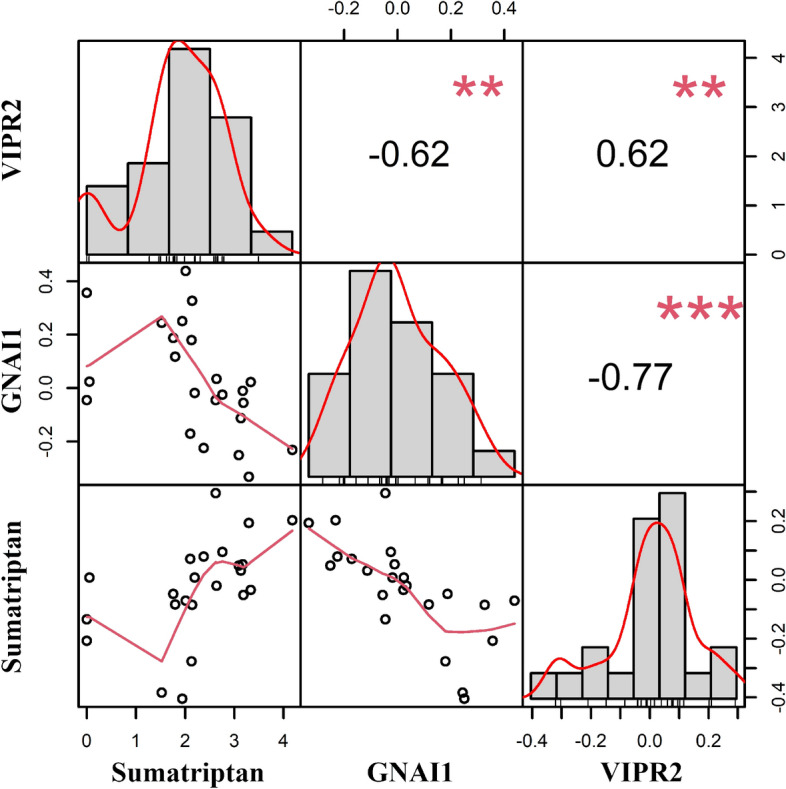
Figure 3.

Visualization of correlation matrix of sumatriptan with genes known to be involved in cAMP regulation, i.e., GNAI1 and VIPR2. Above the diagonal the absolute value of the correlation with significance (**p < 0.01, ***p < 0.001), on the diagonal histograms of the change in expression of VIPR2, GNAI1 and sumatriptan, and below the diagonal the bivariate scatterplots. Note that values on both y- and x-axis are change in levels/expression after treatment with sumatriptan.
