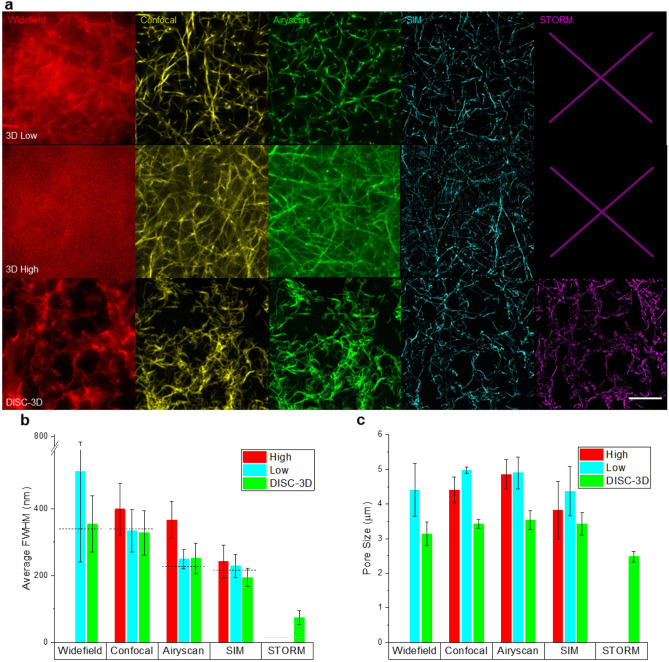
Figure 4.
(a) Collagen I images taken (top) in 3D ≈ 10 μm above the coverslip [3D low], (middle) in 3D > 100 μm into the gel [3D high], and (bottom) following DISC-3D preparation (4 μm slices). From left to right, the columns show images taken using widefield microscopy, confocal microscopy, Airyscan imaging, lattice SIM, and STORM in a HILO implementation. No image is presented for 3D STORM imaging in the top two rows because (3D low) filtering out-of-plane light was insufficient or (3D high) the technique could not be implemented at such depths. Scale bar = 20 μm. (b) Mean measured full width at half maximum (FWHM) of collagen fibers from each microscopy technique. Error bars show standard deviation. Expected minimum FWHM of each approach is shown via dashed horizontal lines. (c) Pore size of collagen networks determined across imaging techniques and sample preparations (see Methods for details). Error bars show standard deviation. Statistical significance, number of samples assessed, and additional information about resolution of each technique are provided in Fig. S4.

