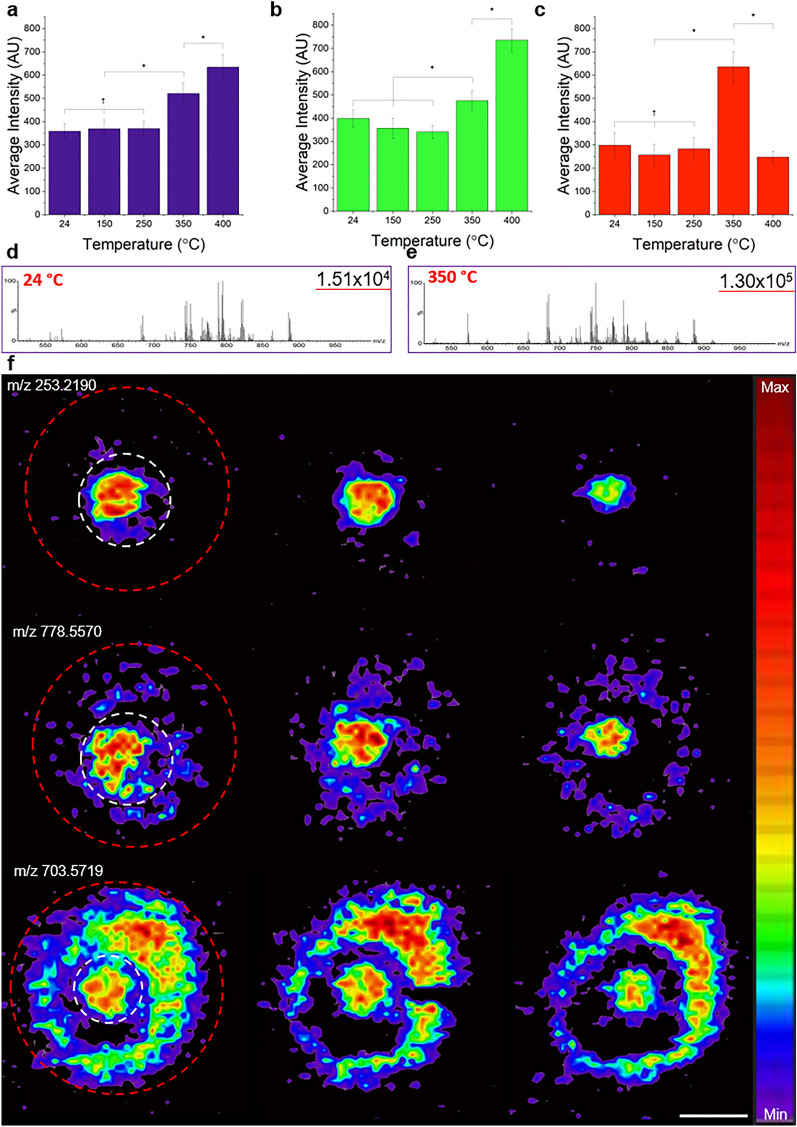
Figure 5.
Mass spectrometry imaging of DISC-3D samples (10 μm slices) of MDA-MB-231 spheroids. Average intensity from mass spectrometry signals averaged over spheroid sections at various temperatures across (a) the full 200–1000 m/z range, (b) the 300–500 m/z range, and (c) the 700–900 m/z range. Statistical results shown here were conducted as pairwise samples. A full description of statistical results is presented in Fig. S6b. n = 8 in all cases except 150 °C, where n = 7. *p < 0.05, †p > 0.05. (d,e) Representative normalized mass spectra collected from invasive spheroids following the DISC-3D protocol at (d) 24 °C and (e) 350 °C demonstrating the increase in signal intensity in the ≈ 650–900 m/z regime. Number at right on each panel indicates maximum intensity peak at that temperature. (f) Representative mass spectrometry images prepared following the DISC-3D protocol outlined in Fig. S1d, showing consecutive sections of single spheroids for several signal ions. In the first serial section of each signal ion, the spheroid core is marked by a white dotted line and the invasive front is denoted by a red dotted line. Color scale from minimum to maximum intensity is shown for signal ions at right. Scale bar = 500 μm.

