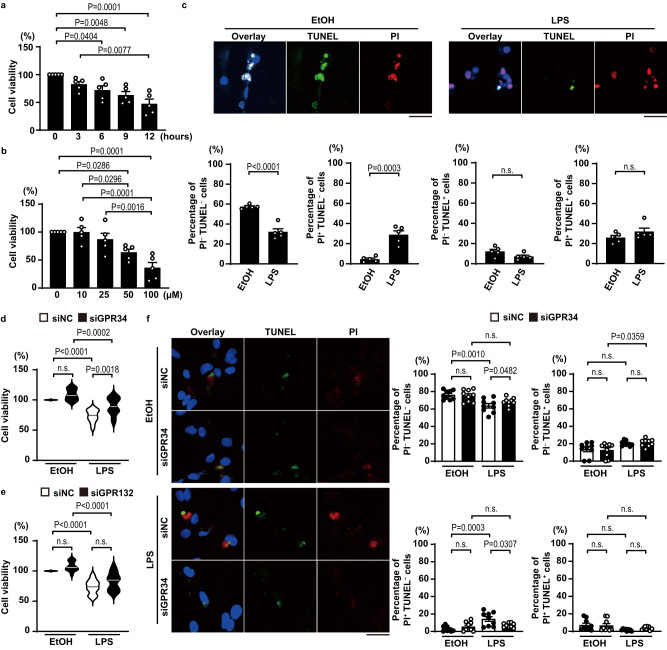
Fig. 5. 18:0 lysophosphatidylserine-induced cell death in rat neonatal cardiomyocytes.
a, b Cell viability assay. Cell viability was measured using the Cell Titer-Blue Assay Kit. Isolated rat neonatal cardiomyocytes were treated with 50 μM 18:0 lysophosphatidylserine for the indicated time, or with the indicated concentration of 18:0 lysophosphatidylserine for 12 h. The percentage of cell viability is shown in the graphs (n = 5). The data were evaluated by one-way ANOVA, followed by Tukey-Kramer’s post-hoc test. c Immunofluorescent analysis of TUNEL (green), propidium iodide (PI) (red) and DAPI (blue) stained-neonatal cardiomyocytes after stimulation with 50 μM 18:0 lysophosphatidylserine (LPS) for 12 h. Scale bars, 50 μm. Necrosis was assessed by PI+ and TUNEL–, while early apoptosis was assessed by PI– and TUNEL+ and late apoptosis was assessed by PI+ and TUNEL+. The bottom graphs show quantitative analysis (n = 5). Two-sided unpaired Student’s t-test was used for analysis (EtOH versus LPS in Percentage of PI– TUNEL– cells P = 0.00006). 1% (v/v) ethanol (EtOH) was used as the control sample. d, e The effect of knockdown of LPS receptors on cell viability. Isolated neonatal cardiomyocytes were transfected with siRNAs targeting GPR34 or GPR132 (siGPR34 or siGPR132) or with negative control siRNA (siNC). These cells were treated with 50 μM LPS for 12 h. The percentage of cell viability is shown in the graphs (n = 12). The data were analyzed by one-way ANOVA, followed by Tukey-Kramer’s post-hoc test (siNC EtOH versus siNC LPS in (d, e) P = 0.0000005 and P = 0.0000007, respectively, siGPR132 EtOH versus siGPR132 LPS P = 0.000002). Open and closed bars indicate siNC and siGPR34 or siGPR132, respectively. f Immunofluorescent analysis of TUNEL, PI and DAPI stained-cardiomyocytes after stimulation with 50 μM LPS for 12 h under the condition of GPR34 knockdown. Scale bar, 50 μm. The graphs show quantitative analysis (n = 9). The data were evaluated by one-way ANOVA, followed by Tukey-Kramer’s post-hoc test. Open and closed bars indicate siNC and siGPR34, respectively. In violin plots, solid lines show median. In bar graphs, data are expressed as the mean ± SEM. Source data are provided as a Source Data file.

