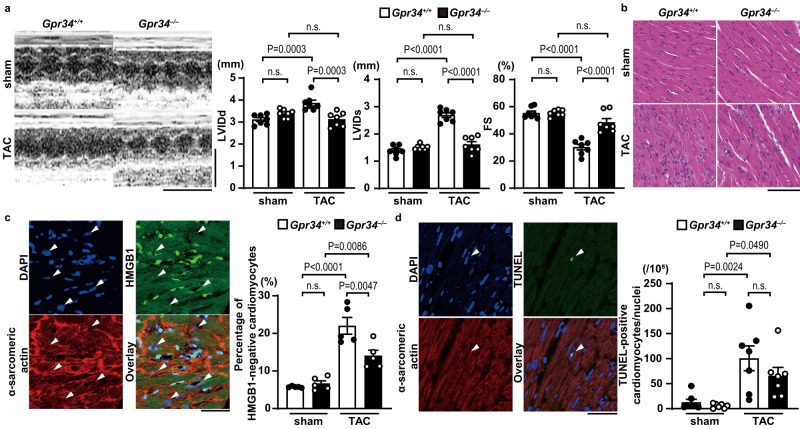
Fig. 6. The protective effect of GPR34 deficiency from pressure overload in the heart.
Gpr34+/+ and Gpr34–/– mice were subjected to TAC and then analyzed 5 days after the operation. a Representative images of transthoracic M-mode echocardiographic tracing. Scale bars, 0.2 s and 5 mm, respectively. The graphs show echocardiographic parameters of the mice (n = 7, biologically independent samples. Sham Gpr34+/+ versus TAC Gpr34+/+ in LVIDs and FS P = 0.0000000001 and P = 0.0000002, respectively, TAC Gpr34+/+ versus TAC Gpr34–/– in LVIDs and FS P = 0.000000006 and P = 0.00006, respectively). b Representative images of the hematoxylin-eosin-stained heart sections. Experiment was repeated five times independently with similar results. Scale bar, 100 μm. c Immunofluorescence analysis of HMGB1 (green), α-sarcomeric actin (red) and DAPI (blue) in the heart after TAC (n = 5, biologically independent samples. Sham Gpr34+/+ versus TAC Gpr34+/+ P = 0.000002). Arrow heads indicate HMGB1-negative nuclei. Scale bar, 50 μm. The graph shows the percentage of HMGB1-negative cardiomyocytes. d Representative confocal images of TUNEL (green)-positive cardiomyocytes. Arrow heads indicate TUNEL-positive nuclei. Scale bar, 50 μm. Red, α-sarcomeric actin; blue, DAPI. The graph shows quantitative analysis of TUNEL-positive cardiomyocytes. (n = 7, biologically independent samples). Open and closed bars indicate Gpr34+/+ and Gpr34−/−, respectively. Data are expressed as the mean ± SEM. The data were evaluated by one-way ANOVA, followed by Tukey-Kramer’s post-hoc test. Source data are provided as a Source Data file.

