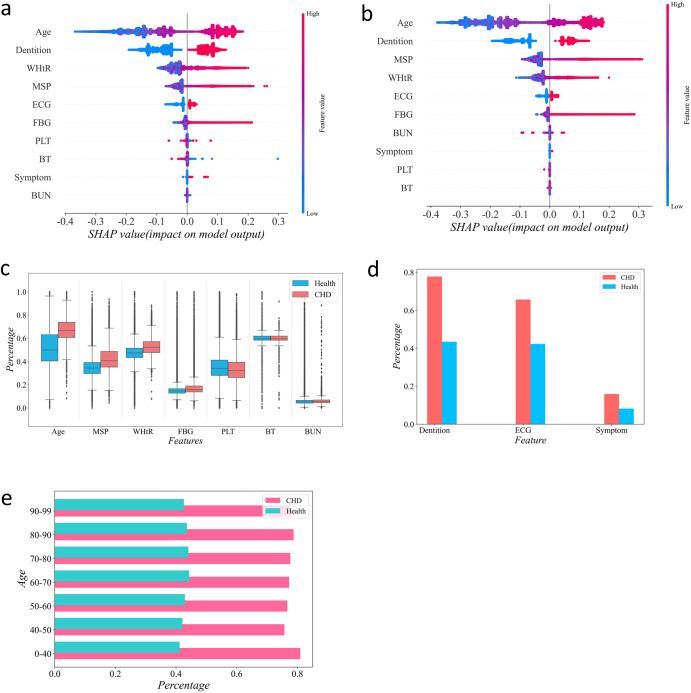
Fig. 2. Statistical results of risk factors for CHD.
a SHAP summary plot for male CHD risk model. b SHAP summary plot for female CHD risk model. c Statistical analysis for the seven optimal continuous features in healthy people (blue) and CHD patients (red). d Statistical analysis for the three optimal discrete features in healthy people (blue) and CHD patients (red). e The proportion of abnormal dentition in healthy people (blue) and CHD patients (blue) in different age groups.

