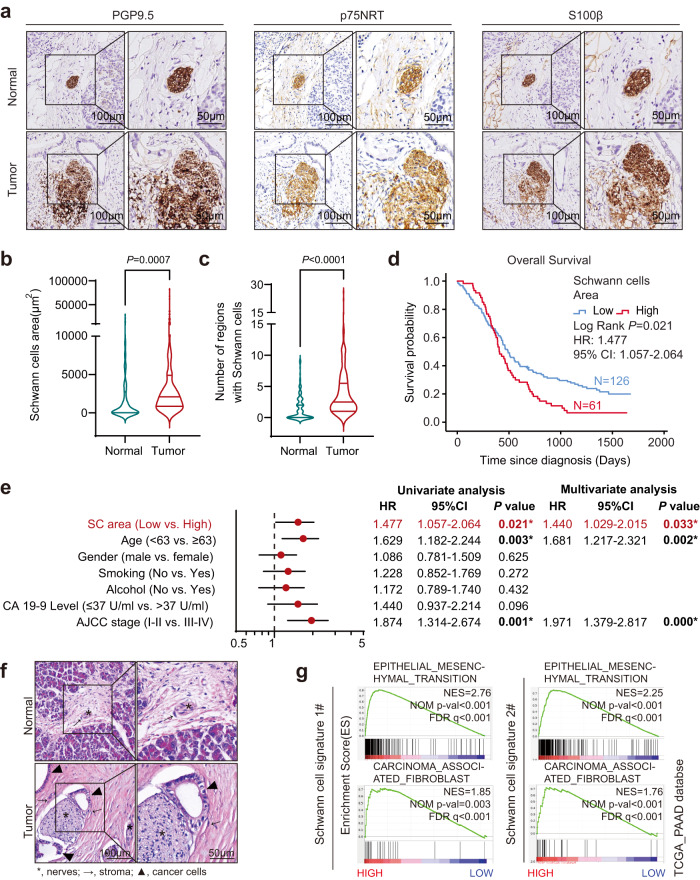
Fig. 1. Prevalence of Schwann cell accumulation in the TME and its clinical significance.
a Representatives of IHC staining images with anti-PGP9.5, p75NRT, and S100β. Scale bar, left, 100 µm; right, 50 µm. Images are representative of 187 PDAC samples with similar results. b, c Violin chart of Schwann cells area (b) or the number of regions used for calculating Schwann cells area (c). For each violin, the minimum, first quartile, median, third quartile, and maximum were displayed. n = 187. d OS analysis of PDAC patients with low Schwann cells area (<3190 μm2; n = 126) or high area (≥3190 μm2; n = 61) in PDAC patients (n = 187). The cutoff of Schwann cells area was determined by X-Tile76. HR and 95% CI were determined using the regression coefficient of the Cox model. e Univariate and multivariate analysis of the OS of PDAC patients (n = 187). The dot of the Forest plot represents the hazard ratio of the Cox proportional hazards model, the error bars are two-sided 95% confidence intervals. *P < 0.05. Independent variables with P < 0.05 in the univariate analysis were included in the multivariate analysis. f H&E staining showing nerves, stroma, and cancer cells in PDAC tumor and normal tissue. asterisk, nerves; arrow, stroma; triangle, cancer cells. Images are representative of three PDAC samples with similar results. Scale bar, left, 100 µm; right, 50 µm. g GSEA plot showing that EMT and carcinoma-associated fibroblasts were enriched in PDAC samples with higher expression of Schwann cell signatures. Pathway enrichment analysis was performed using data from the TCGA-PAAD cohort. NES normalized enrichment score, corrected for multiple comparisons using FDR method, P value were showed in plots. Statistical analysis: unpaired two-sided t-test (b, c); log-rank test (d). Source data are provided as a Source Data file.

