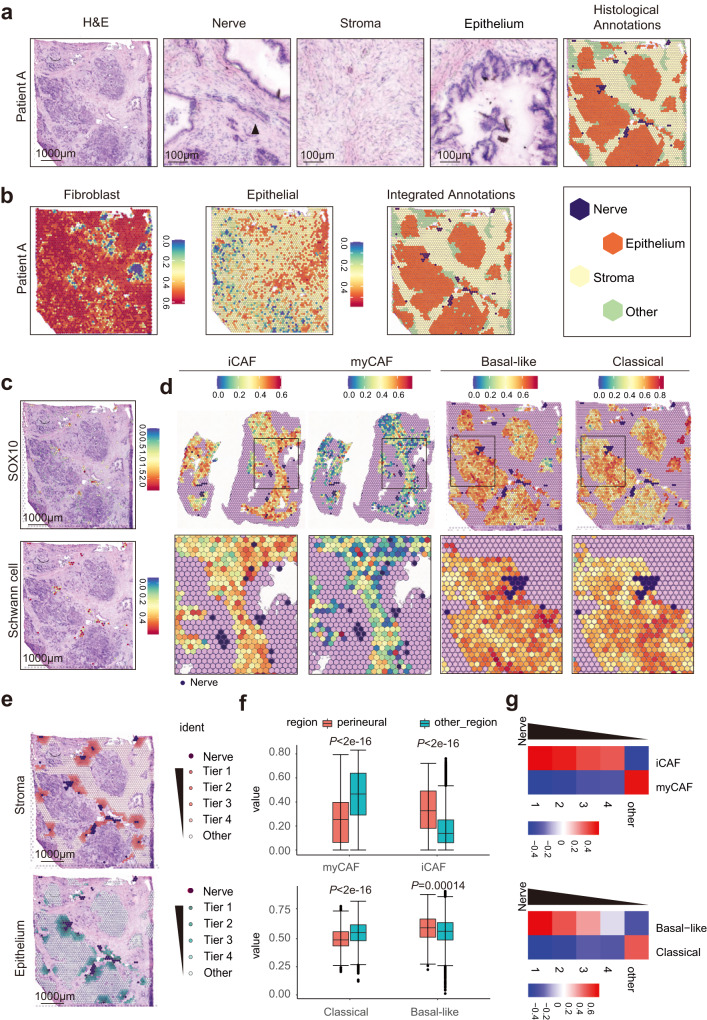
Fig. 3. Microarray-based spatial transcriptomics reveals that Schwann cells are surrounded by iCAFs and basal-like tumor cells.
a Histological annotations of tumor cryosection from patient A. Images are representative of four PDAC samples with similar results. Scale bar, left, 1000 µm; right, 100 µm. b Stroma and epithelium regions were defined by integrating the results of ssGSEA and histologic annotation. c Schwann cell markers SOX10 was co-localized with nerve region in Patients A (upper panel). The score of Schwann cell signature determined by ssGSEA is high in nerve regions (lower panel). Scale bar, 1000 µm. d The scores of iCAF, myCAF, basal-like and classical signatures determined by ssGSEA in the neuro-stroma niche. e Perineural tier 1‒4 and other regions were defined according to the distance to a nerve in the neuro-stroma niche. Scale bar, 1000 µm. f The ssGSEA scores of iCAF, myCAF, basal-like and classical signature in the perineural region (tier 1) compared with the other regions (tier 2‒4 and other regions). For each boxplot, the first quartile, median, and third quartile ± s.d were displayed. Patients number = 4, nerves number = 40. g The QuSAGE scores of iCAF, myCAF, basal-like, and classical signature in tier 1‒4 and other regions in the neuro-stroma niche. Statistical analysis: two-sided Wilcoxon rank-sum test (f).

