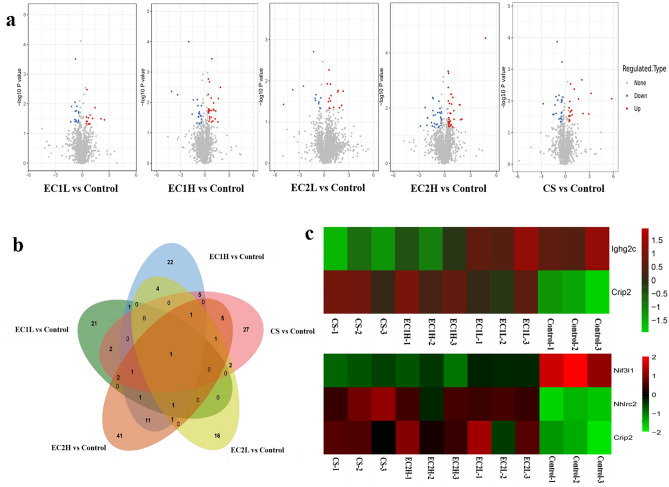
Figure 2.
Analysis of differentially expressed proteins in cardiac tissue. (a) Volcano plot was drawn with the fold change transformed by Log2 as the horizontal axis and the logarithm of the P-value (− Log10) as the vertical axis. The red dot represents the up-regulated proteins, and the blue dot represents the down-regulated proteins. (b) The approximate relationship between differentially expressed proteins in EC and CS was plotted using a Venn diagram. (c) Heatmap showing the expression of common differentially expressed proteins, with red indicating up-regulation and green indicating down-regulation.

