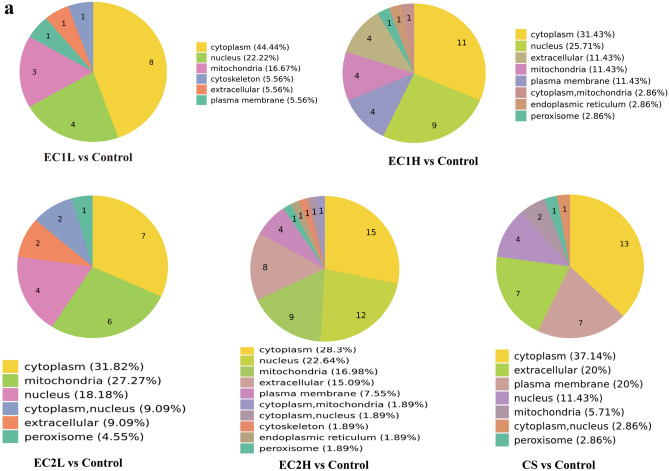
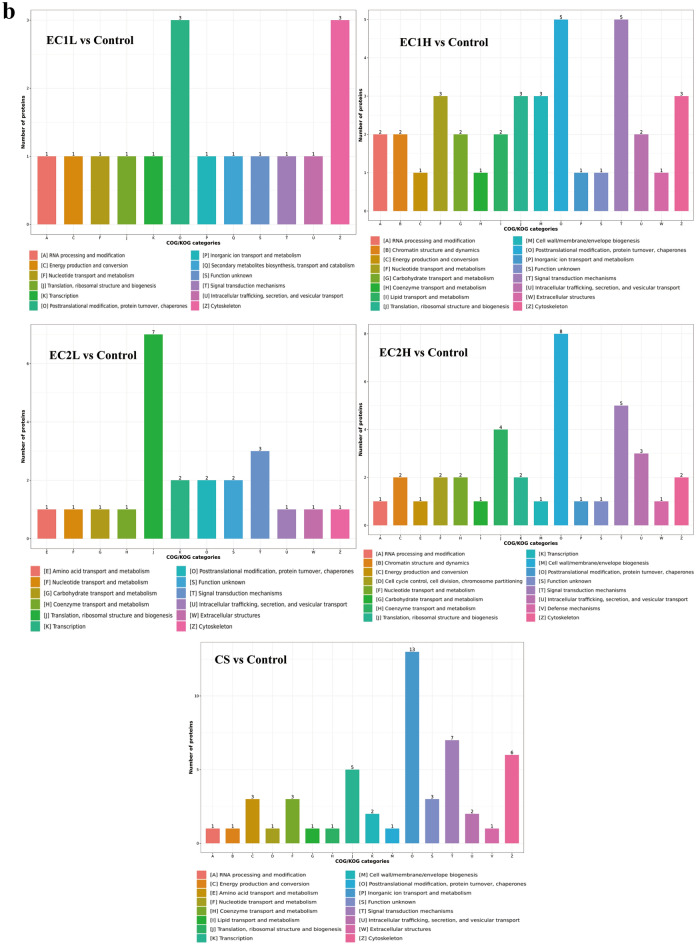
Figure 4.
Enrichment analysis of differentially expressed proteins. (a) Differential proteins in each group were predicted for subcellular localization using Wolfpsort software. The numbers in the fan chart represent the number of differential proteins, and different colors mark the classification of subcellular structure and the percentage of differential proteins. (b) The COG/KOG functional classification of differentially expressed proteins was performed by database matching analysis. The abscissa is the COG/KOG functional classification, and the ordinate is the protein quantity.


