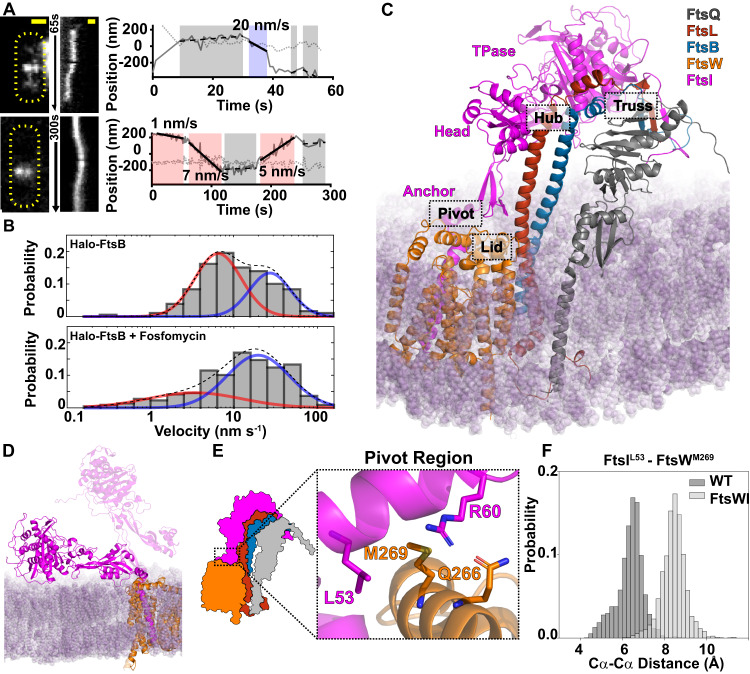
Fig. 1. Characterization and modeling of the E. coli FtsQLBWI complex.
A, B Single-molecule tracking of Halo-FtsB suggests that FtsQLB remain in complex with FtsWI on both the fast-moving FtsZ-track and the slow-moving sPG synthesis track. A Two representative Halo-FtsB expressing cells with the maximum fluorescence intensity projection images (left), kymographs of fluorescence line scans at the midcell (middle), and unwrapped one-dimensional positions of the corresponding Halo-FtsB molecule along the circumference (solid gray line) and long axis (dotted gray line) of the cell were shown. Measured velocity of each segment and the corresponding classification (fast-moving, cyan; slow-moving, pink; stationary, gray) are labeled in the trajectory panels. Scale bar 500 nm. Similar images were observed in N > 100 cells. B Distribution of velocities of single Halo-FtsB molecules exhibiting directional motion in wild-type E. coli cells grown in minimal media in the absence (top) of fosfomycin was best fit with two moving populations, one slow (red) and one fast (blue). A dashed line indicates the summed probability. In the presence of fosfomycin that inhibits cell wall synthesis (bottom), the slow-moving population (red) is drastically reduced. These dynamics behaviors are similar to those of FtsW or FtsI17. C Modeled structure of E. coli FtsQLBWI within a POPE bilayer (purple) in the last frame of a 1-μs MD simulation. The complex consists of FtsQ 20–276 (gray), FtsL 1–121 (red), FtsB 1–113 (blue), FtsW 46–414 (orange), and FtsI 19–588 (magenta). The FtsI TPase, head and anchor domains are labeled in magenta text. The four interface regions—Pivot, Truss, Hub, and Lid—are highlighted in dashed boxes. D In the absence of FtsQLB, FtsI (magenta) collapses to the membrane (purple) at the end of the 1-μs MD simulation. The position of FtsI at the beginning of the simulation (transparent magenta) is shown for comparison. E Zoomed-in view of the Pivot region in FtsQLBWI, in which interactions between FtsIL53 (magenta) and FtsWM269 (orange) and between FtsIR60 (magenta) and FtsWQ266 (orange) secure the position of the FtsI anchor domain (magenta) with respect to FtsW (orange). F In the absence of FtsQLB, interactions between FtsIL53 and FtsWM269 are broken, as shown by the increased Cα-Cα distances between the two residues (light gray) compared to that in the presence of FtsQLB (WT, dark gray) in the last 500 ns of the MD simulation. Source data are provided as a Source Data file.

