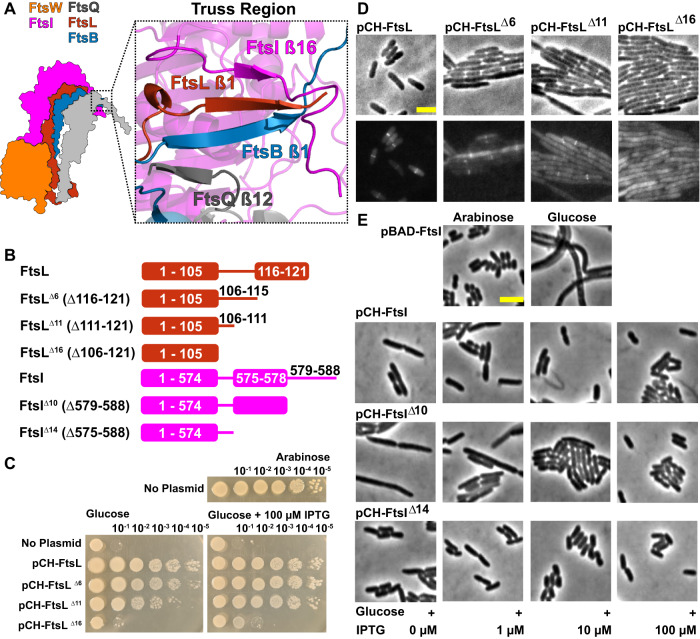
Fig. 2. C-terminal extended β-sheet of FtsQLBI in the Truss region is important for cell division.
A A detailed view of the Truss region in the final frame of the FtsQLBWI 1-μs MD simulation illustrates β-sheet interactions between the C-terminal ends of FtsQ (gray), FtsB (blue), FtsL (red), and FtsI (magenta). B Cartoon showing FtsL and FtsI β-strand truncation mutants. Also see Fig. S12 for details. C Spot dilution complementation test of FtsL truncation mutants. E. coli cells depleted of chromosomal wild-type FtsL but contain FtsL expressed from the PBAD promoter (strain MDG279, Table S2) complemented in the presence of arabinose (top panel), but failed in the presence of glucose (No Plasmid, first rows of the bottom panel). The same depletion strain (MDG279) expressing wild-type FtsL (pCH-FtsL, or pBMB064), FtsLΔ6 (pCH-FtsLΔ6, or pBMB065) and FtsLΔ11 (pCH-FtsLΔ11, or pBMB066, Table S1) from a lac promoter on plasmids complemented the depletion in the presence of glucose at both no induction and 100 μM IPTG conditions (middle rows of both panels). pCH-FtsLΔ16 is unable to complement at both conditions (bottom rows of the bottom panel). See Fig. S13 for more induction conditions. D Images of E. coli cells depleted of wild-type FtsL and expressing an mVenus fusion to FtsL of various truncations showed that truncations of FtsL of increasing length exhibited increasing cell length (top) and decreased FtsL midcell localization (bottom) relative to cells expressing mVenus fused to full-length FtsL. Scale bar 3μm. See Fig. S13 for quantifications. E Images of E. coli cells depleted of wild-type FtsI and expressing FtsI truncations. A wild-type FtsI fusion and FtsIΔ14 exhibit near-normal cell lengths even at low induction levels, while FtsIΔ11 exhibits filamentous cells at low expression levels. Scale bar 3 μm. See Fig. S14 for quantifications. Source data are provided as a Source Data file.

