Figure 1.
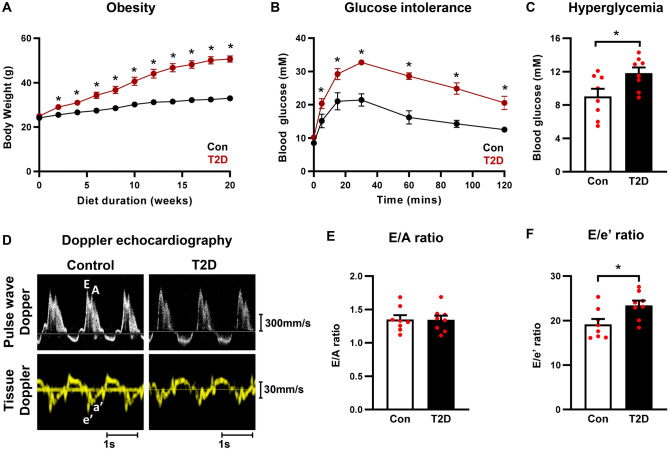
High fat high sugar diet-induced T2D mice exhibit obesity, impaired glucose tolerance, hyperglycemia and diastolic function. (A) Body weight progression throughout the 20 week dietary intervention. Note, in some instances error bars are not discernible as they fall within symbol shapes. Analyzed by 1-way repeated measures ANOVA, annotated with LSD post hoc analyses. (B) Glucose tolerance test in T2D mice (11 weeks high fat high sugar diet). Note, in some instances error bars are not discernible as they fall within symbol shapes. Analyzed by 1-way repeated measures ANOVA, annotated with LSD post hoc analyses. (C) Blood glucose levels in T2D mice at study endpoint (20 weeks high fat high sugar diet). Analyzed by Students unpaired t-test. (D) Representative Doppler echocardiography traces for control and T2D mice. Upper panels, mitral valve pulse wave (blood flow) Doppler imaging. Lower panels, mitral annulus tissue Doppler imaging. (E) Ratio of pulse wave Doppler E wave to A wave amplitude in T2D mice (20 weeks high fat high sugar diet). Analyzed by Students unpaired t-test. (F) Ratio of mitral valve flow Doppler E wave to mitral annulus tissue Doppler e’ wave in T2D mice (20 weeks high fat high sugar diet). Analyzed by Students unpaired t-test. Data are presented as mean ± SEM. n = 8/group. *p < 0.05.

