Figure 5.
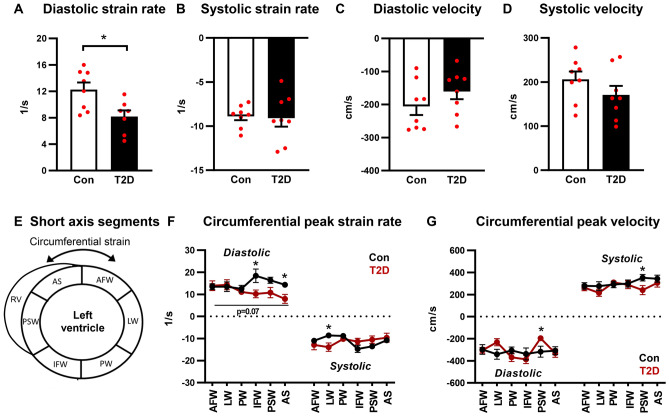
Circumferential diastolic strain rate is reduced in T2D mice. (A,B) Circumferential diastolic and systolic peak strain rate, acquired in the short axis imaging plane. Analyzed by Students unpaired t-test. (C,D) Circumferential diastolic and systolic peak velocity, acquired in the short axis imaging plane. Analyzed by Students unpaired t-test. (E) Schematic of short axis view left ventricle segmentation for regional strain analysis. (F) Regional circumferential peak strain rate. Analyzed by 1-way repeated measures ANOVA, annotated with LSD post hoc analyses. P = 0.07 T2D factor effect. (G) Regional circumferential peak velocity. Analyzed by 1-way repeated measures ANOVA, annotated with LSD post hoc analyses. Data are presented as mean ± SEM. n = 7–8/group. *p < 0.05. RV right ventricle, AFW anterior free wall, LW lateral wall, PW posterior wall, IFW inferior free wall, PSW posterior septal wall, AS anterior septum.

