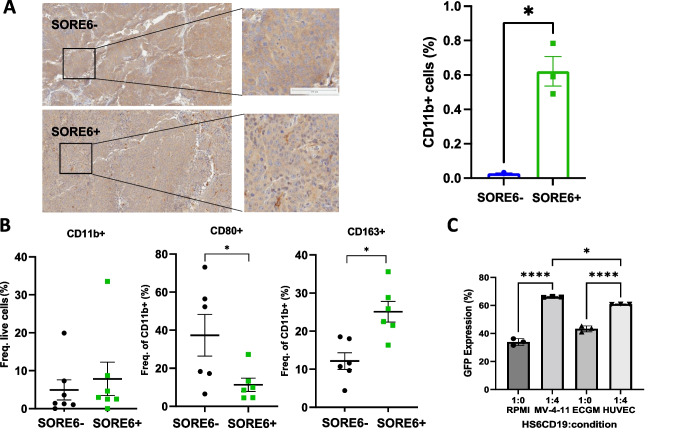
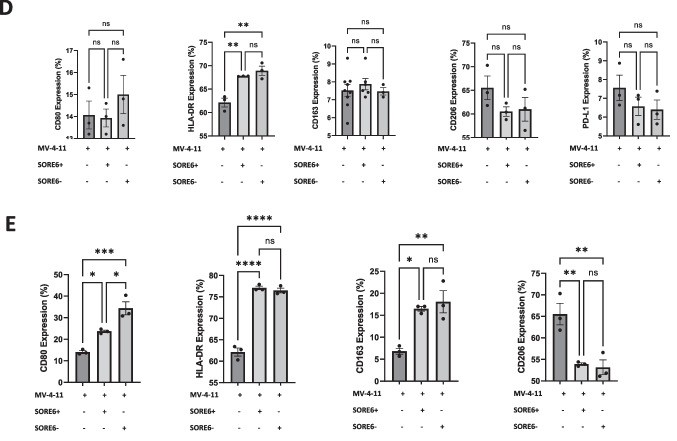
Fig. 4.
SORE6+ cells demonstrate enhanced in-vivo and in-vitro macrophage polarization. a Representative result from IHC staining of CD11b on the tumors derived from SORE6± HuCC-T1 cells. Brown indicated CD11b positive and blue for nuclei staining. The right-hand graph depicts the quantification of CD11b + cells in both tumor samples. Results were shown as mean ± SEM. N = 3. Scale indicated 100 μm. *p < 0.05. b Dot plots showing frequency of TAM surface markers using flow cytometry in each tumor group. *p < 0.05. N = 6. c GFP expression of HS6CD19 cells measured with flow cytometry at different conditions either alone in different culturing mediums or coculture with MV-4-11 cells or HUVECs. RPM1 was used to culture HuCC-T1 and MV-4-11, while endothelial cell growth medium (ECGM) was used to culture HUVECs. In the coculturing condition, HUVECs and MV-4-11 were cultured in the appropriate medium. *p < 0.05, ****p < 0.0001. Tukey’s multiple comparisons test. Results were shown as mean ± SEM (n = 3 technical replicates). d Bar graph showing flow cytometry analysis of M1 and M2 TAM surface marker expression in MV-4-11 macrophages follow 24-hour indirect coculture with SORE6± HuCC-T1 cells using a transwell system. Results were shown as mean ± SEM (n = 3 technical replicates). **p < 0.01. ns, non-significant. e Bar graph showing flow cytometry analysis of M1 and M2 TAM surface marker expression in MV-4-11 macrophages follow 24-hour direct coculture with SORE6± HuCC-T1 cells. Results were shown as mean ± SEM (n = 3 technical replicates). *p < 0.05, **p < 0.01, ****p < 0.0001, ns, non-significant


