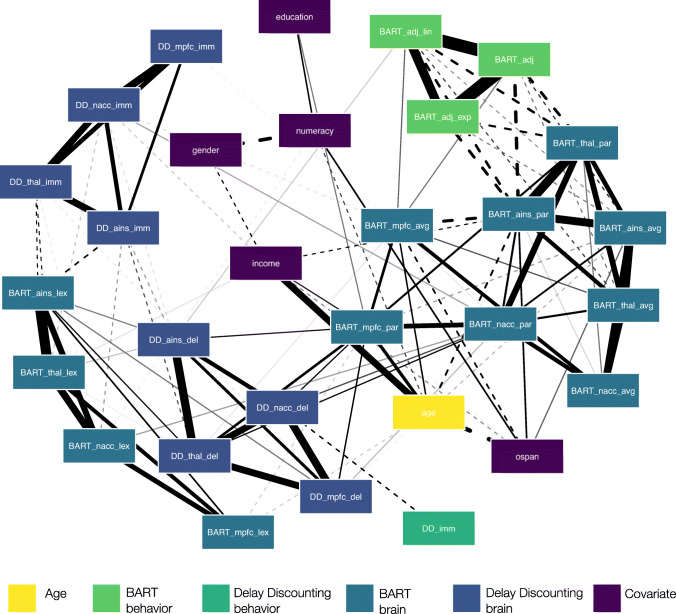
Fig. 5.
Network plot for bivariate associations between age, behavioral and neural markers of decision-making under uncertainty, and covariates. Note: Variables were visually grouped by measure. Edge thickness is indicative of the strength of Pearson correlation coefficients for associations between two variables, with solid (dotted) edges representing positive (negative) associations. We plotted correlations with absolute coefficients of rPearson ≥ 0.15

