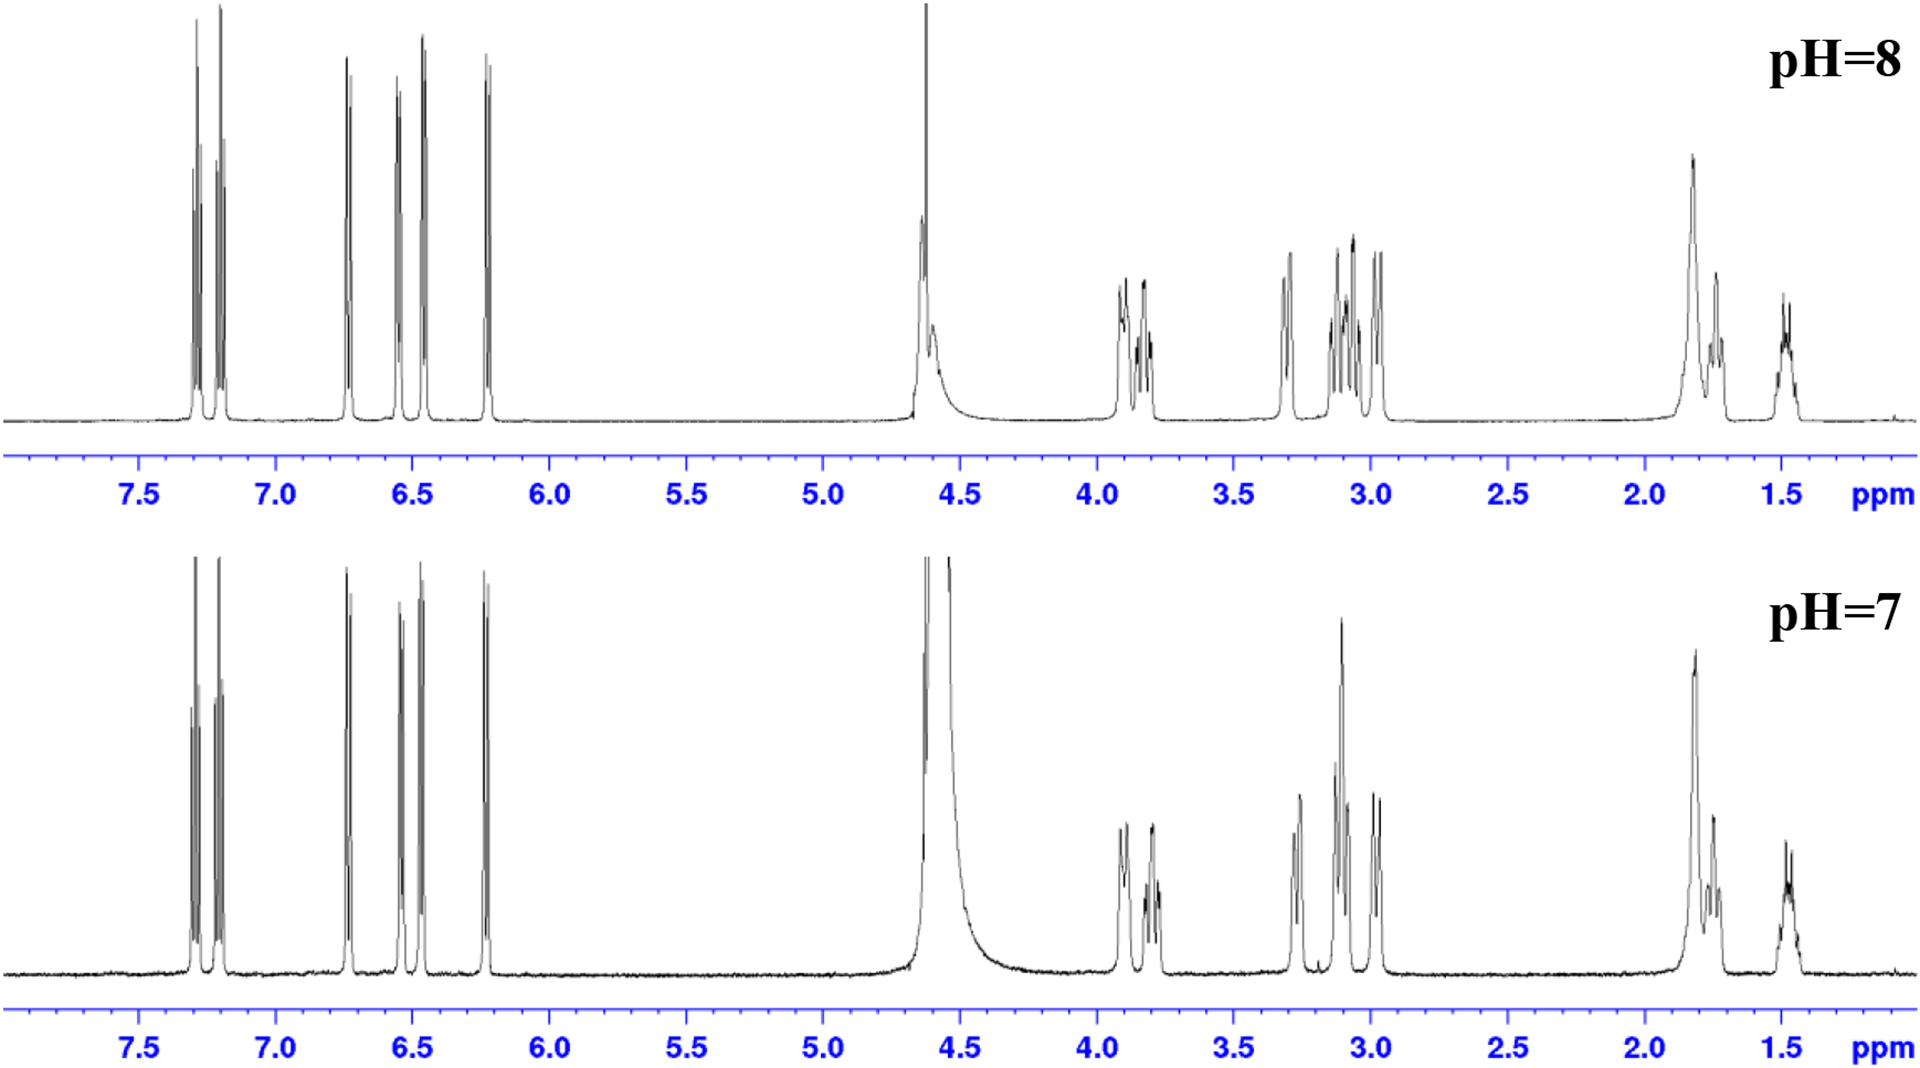
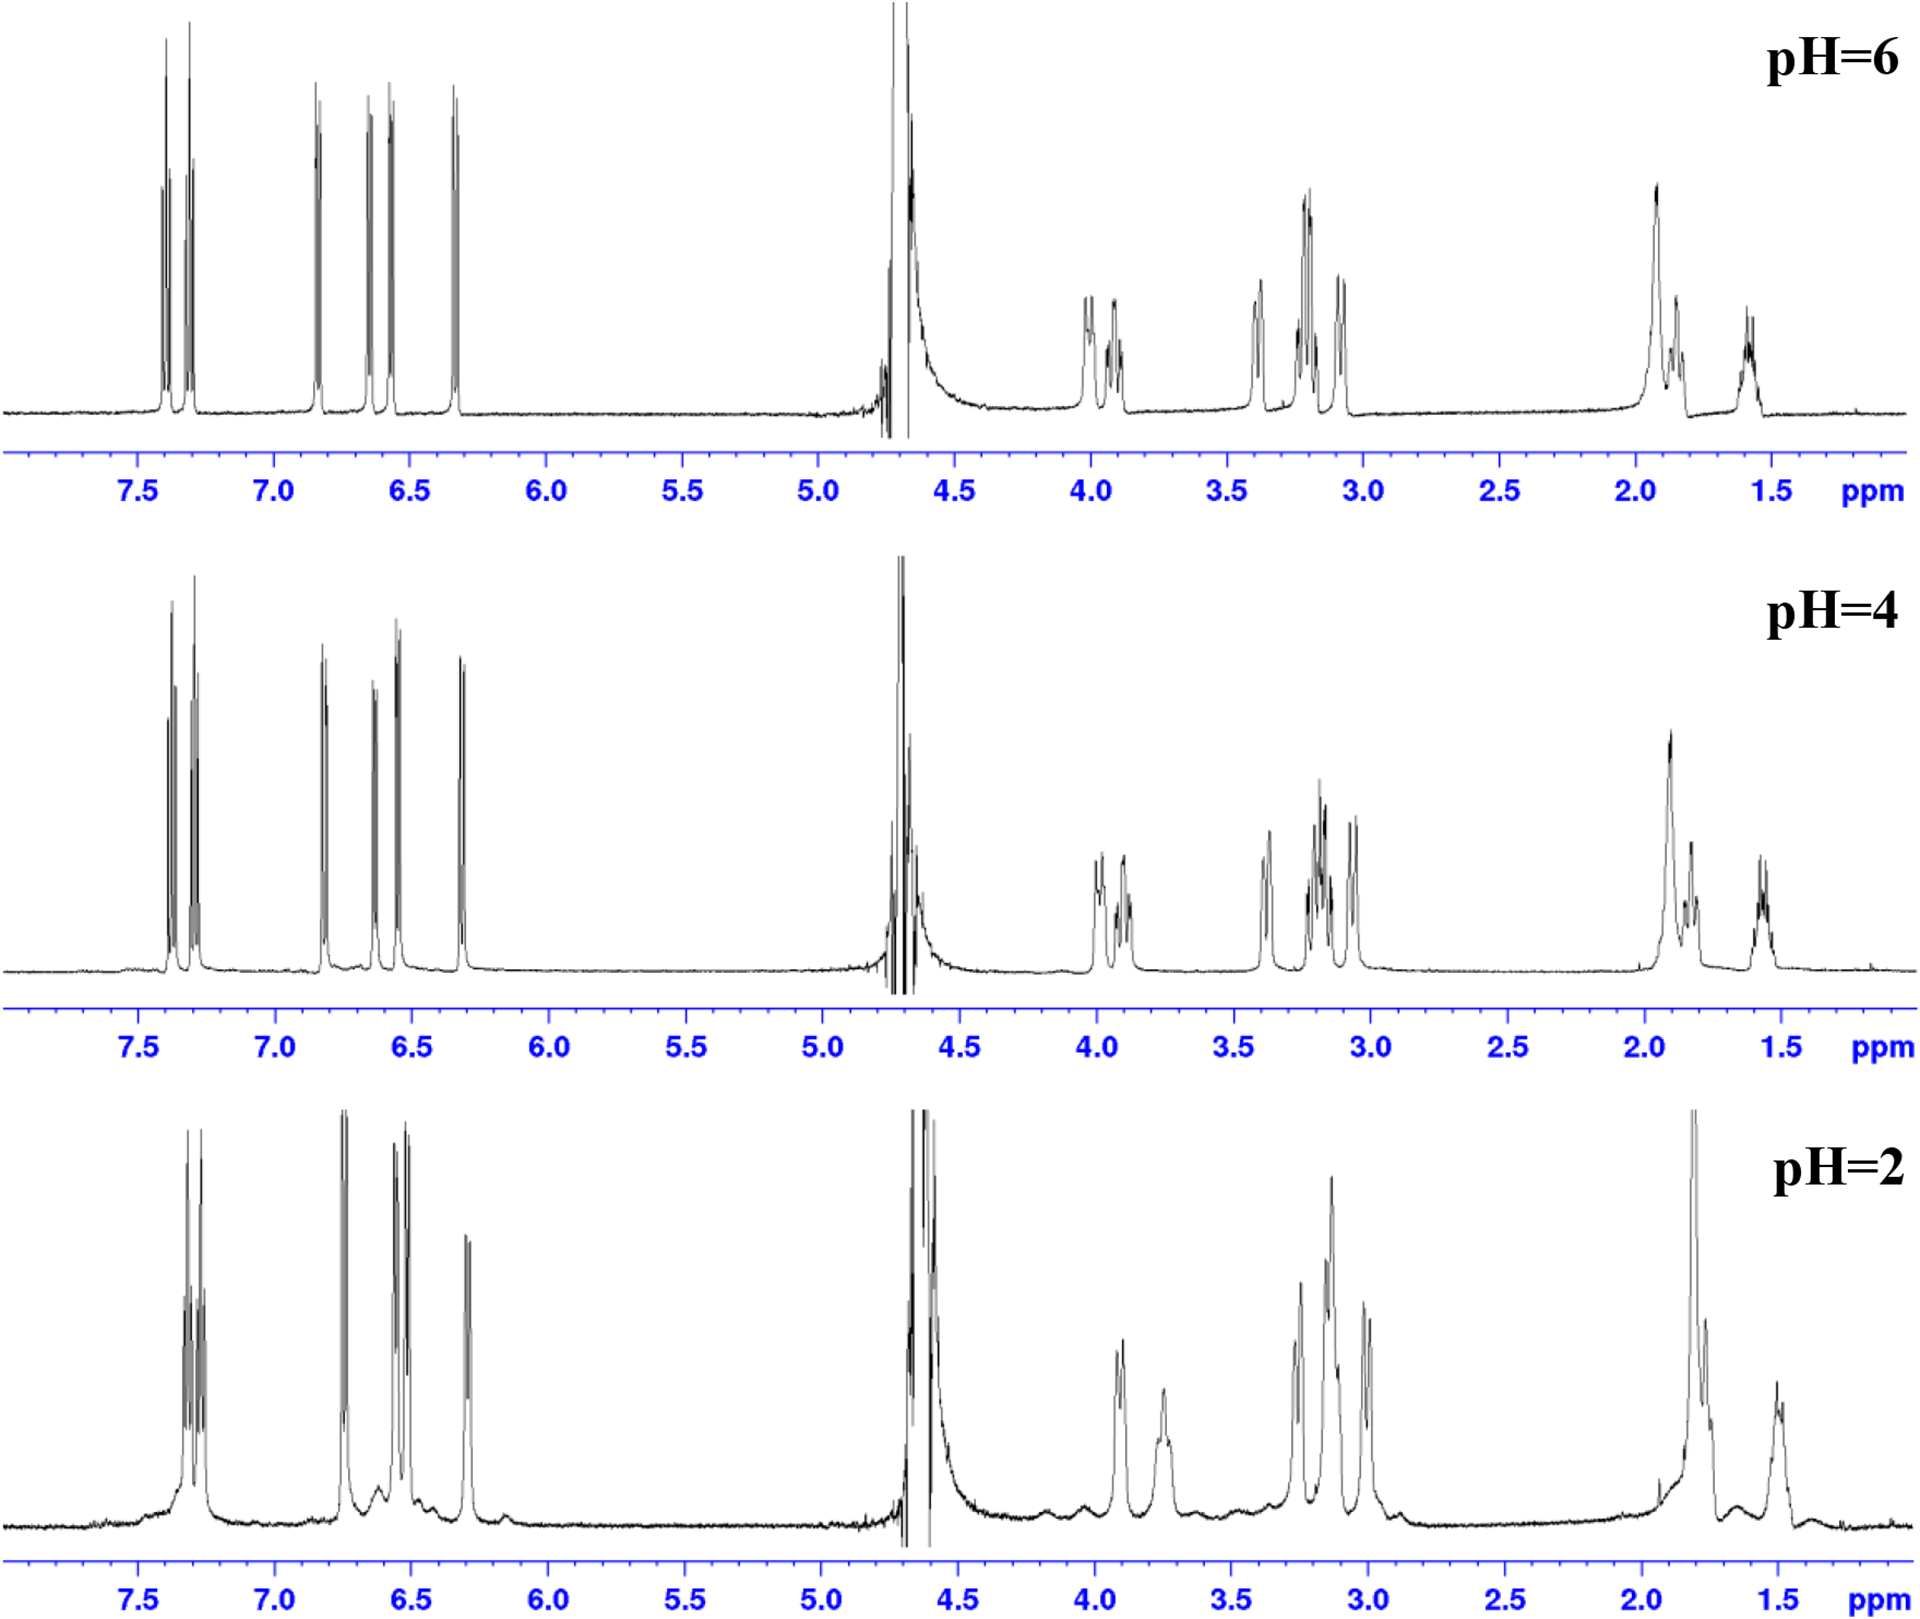
Figure 5.


1H NMR of K[Sc(HOPO)] taken at different pH’s in D2O. pH was measured by pH probe, which introduced H2O to the sample. Although peak suppression for H2O was used in the NMR method, the quantity of water was too great for it to be effective. pH was adjusted with K2CO3 and DCl. The resultant increase of KCl concentration results in minor chemical shift changes for both the analyte and the solvent peak.
