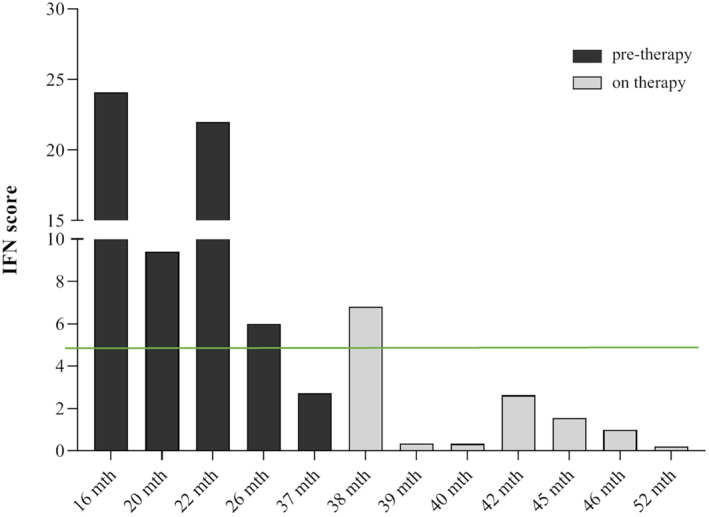
FIGURE 1.

Trend of interferon‐signaling gene expression score before and during treatment with baricitinib. The interferon score was calculated as the median fold changes of expression of a panel of interferon stimulated genes (ISGs: IFI27, IFI44L, IFIT1, RSAD2, ISG15, and SIGLEC1). The green line defines the mean IFN score derived from a pool of 17 healthy controls plus two standard deviations above the mean was calculated. Scores higher than this value (4.67) are designated as positive.
