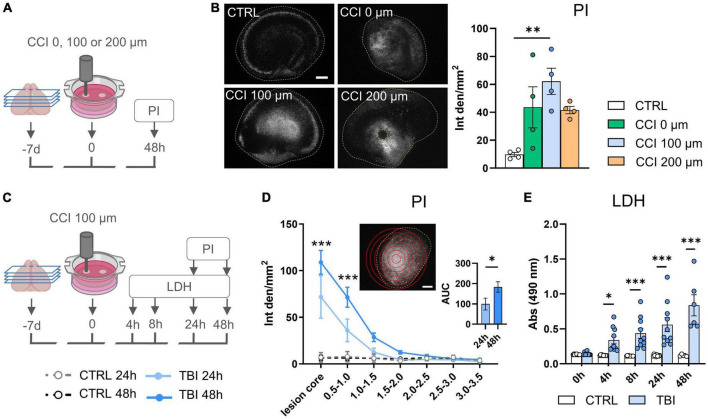
FIGURE 1.
In vitro TBI model set-up. (A) Experimental design of TBI grading by increasing CCI deformation depth from 0 to 200 μm. (B) Representative images and quantification of PI incorporation at 48 h in CTRL and TBI slices. (C) Experimental design for spatio/temporal cell death characterization after TBI. (D) Quantification of regional-specific PI incorporation on concentric ROIs (top insert) and as AUC (bottom insert). (E) Temporal LDH release in culture medium after TBI. Data are mean ± SEM; (B) One-way ANOVA followed by Tukey’s multiple comparisons test; (D,E) Two-way ANOVA followed by Tukey’s multiple comparison test; *p < 0.05, **p < 0.01, ***p < 0.001. (D) n = 6–8. (B–D) bars = 500 μm. Drawings created with BioRender.com.

