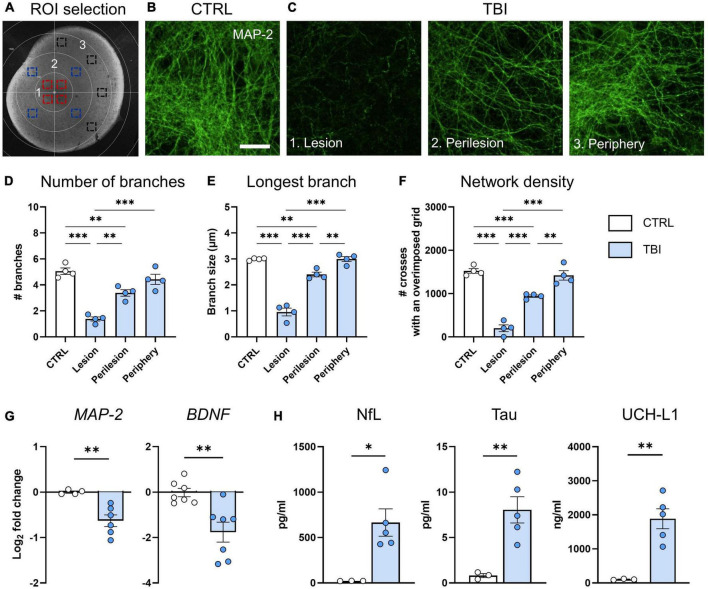
FIGURE 2.
Evaluation of TBI induced neuronal damage 48 h after injury. (A) Representative image of ROIs in the lesion (1, red squares), perilesion (2, blue squares) and periphery (3, black squares). Since MAP2 density was uniform in CTRL slices throughout concentric areas, results are shown as the average of the 12 ROIs. (B) Representative confocal images of MAP-2 staining in CTRL slices and (C) in the lesion, perilesion, and periphery of TBI slices. (D) Quantification of the number of neurite branches, (E) the size of the longest branch and (F) the network density of MAP-2 immunostaining. (G) Gene expression analysis of neuronal-associated MAP-2 and BDNF markers in cortical slices. (H) Levels of neuron-associated biomarkers released in culture media. Data are mean ± SEM. (D–F) One-way ANOVA, followed by Tukey’s multiple comparisons test, (G,H) t-test. *p < 0.05, **p < 0.01, ***p < 0.001. Bar = 25 μm.

