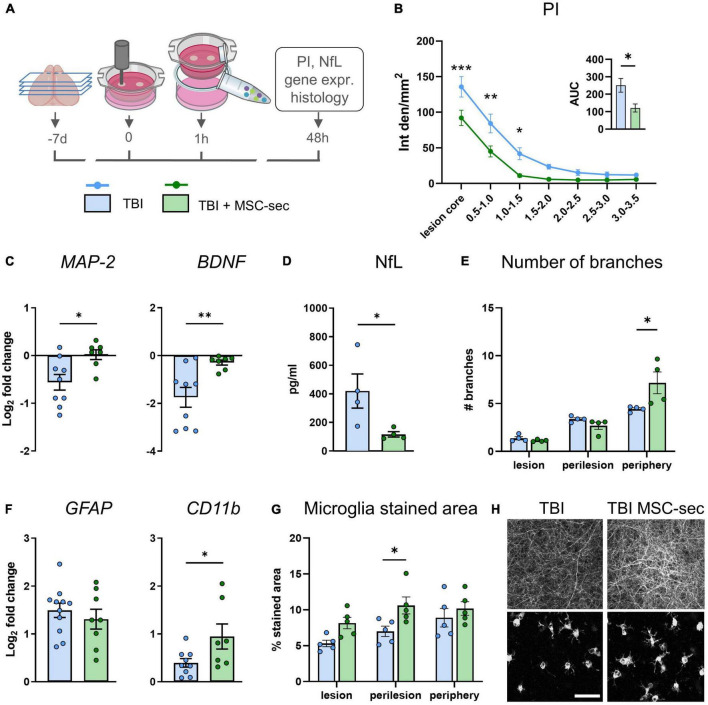
FIGURE 5.
MSC-sec protects brain tissue after TBI. (A) Experimental design. (B) Quantification of PI incorporation at 48 h after injury in concentric ROIs and as AUC (insert). (C) MAP-2 and BDNF gene expression analysis in cortical slices. (D) Levels of NfL biomarker released in culture media. (E) Histological quantification of the number of neurite branches. (F) GFAP and CD11b gene expression analysis. (G) Histological quantification of microglia% stained area. (H) Representative confocal images of MAP-2 staining and microglial cells in TBI and MSC-sec treated slices. Data are mean ± SEM. (B) Two-way ANOVA, followed by Tukey post test, n = 8–10. (C,D,F) t-test, (E,G) Two-way ANOVA, followed by Sidak’s post test, *p < 0.05, **p < 0.01, ***p < 0.001. Bar = 50 μm. Drawings created with BioRender.com.

