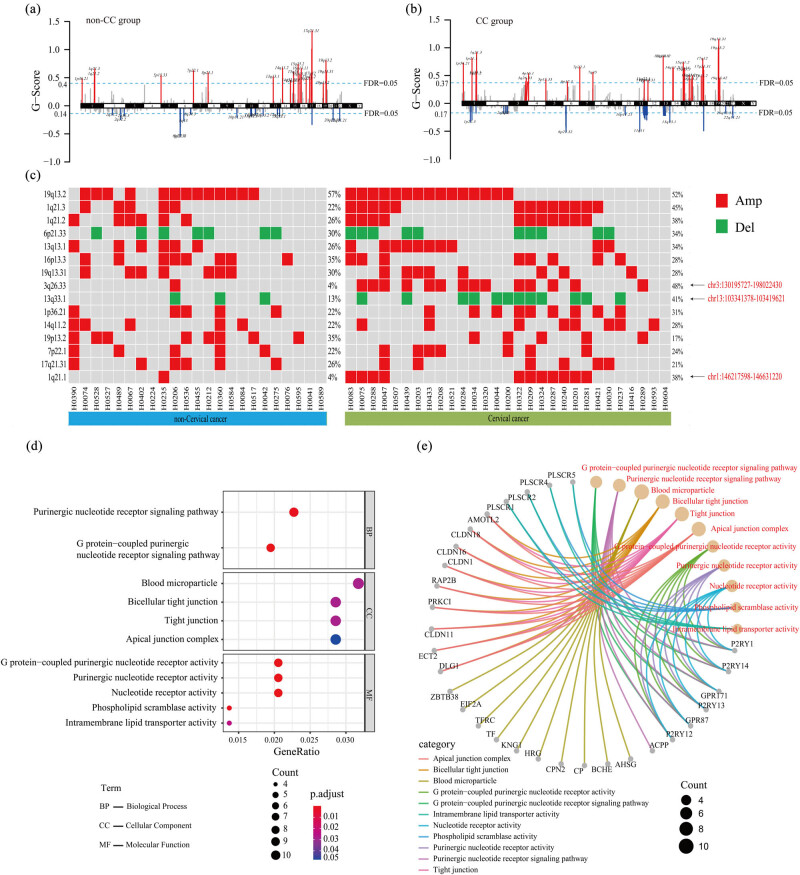
Figure 2.
Analysis of somatic CNV (a and b): The distribution of CNVs on chromosomes in (a) non-cervical cancer and (b) cervical cancer groups Red represents amplification, blue represents deletion, and the light blue dashed line represents FDR = 0.05. (c) The top 15 chromosome regions with high CNV frequency are shown. The red square represents amplification, and the green square represents deletion. The arrows on the right indicate the three regions with significant differences between the two groups. (d) The gene enrichment at the molecular function, biological process, and cellular component levels (FDR < 0.05, P < 0.05) using enrichGO enrichment analysis. The size of the dots in the figure represents the number of genes in the signal pathway, and the corresponding horizontal axis is the percentage of the number of genes in the total number of genes in the signal pathway. The color represents the significance of the enriched term. (e) Significantly enriched pathways and the genes contained in each pathway. Red font indicates the name of the pathway, different line colors represent different pathways, and the size of the dots represents the number of genes in the pathway.

