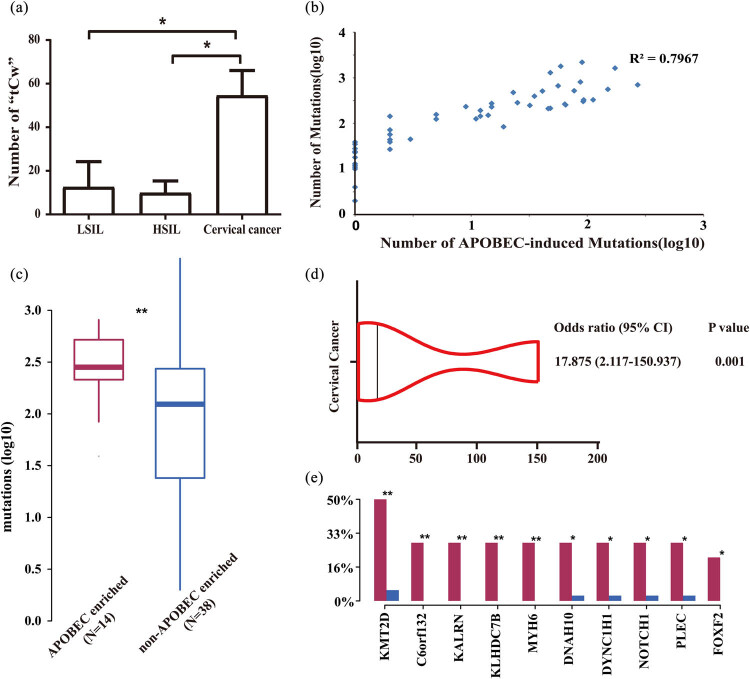
Figure 4.
Analysis of APOBEC-induced mutations in cervical lesions. (a) Comparison of the number of “tCw” mutations in different groups. (b) Correlation analysis between the number of “tCw” mutations and the total number of mutations. (c) APOBEC enrichment analysis. (d) Forest plot of APOBEC enrichment and relative risk of cervical cancer. (e) Genes with a significant difference in mutation frequency between the APOBEC-enriched group and non-APOBEC-enriched group. Compared between the APOBEC-enriched group and the non-APOBEC-enriched group, *P < 0.05, **P < 0.01.

