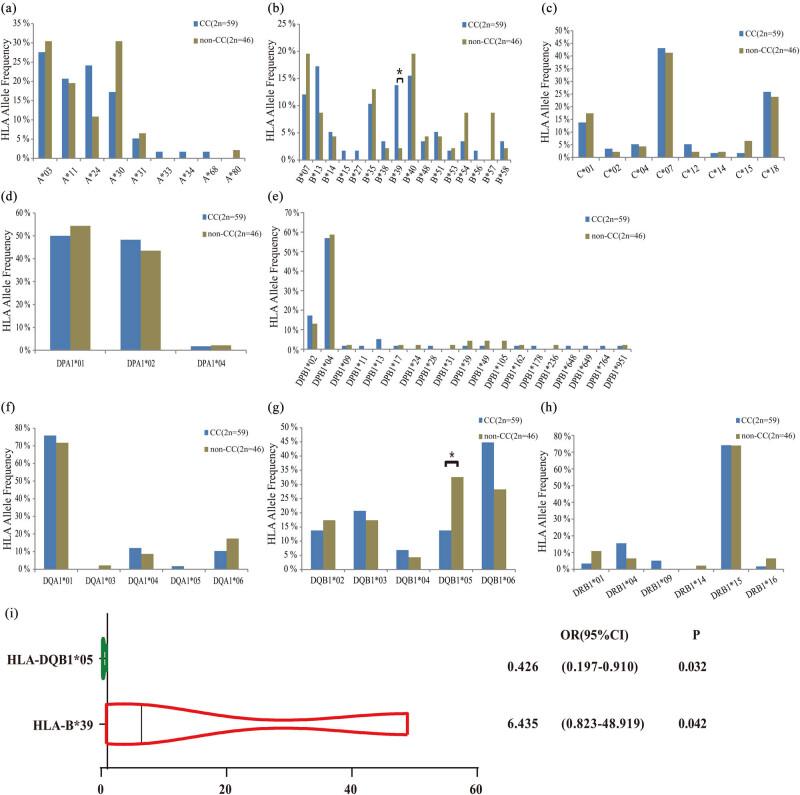
Figure 5.
Analysis of HLA alleles. The distribution of genotypes on different HLA loci between cervical cancer and non-cervical cancer groups. (a) HLA-A genotype distribution; (b) HLA-B genotype distribution; (c) HLA-C genotype distribution; (d) HLA-DPA1 genotype distribution; (e) HLA-DPB1 genotype distribution; (f) HLA-DQA1 genotype distribution; (g) HLA-DQB1 genotype distribution; (h) HLA-DRB1 genotype distribution; (i) forest plot of HLA-B*39 and HLA-DQB1*05 and risk of cervical cancer.

