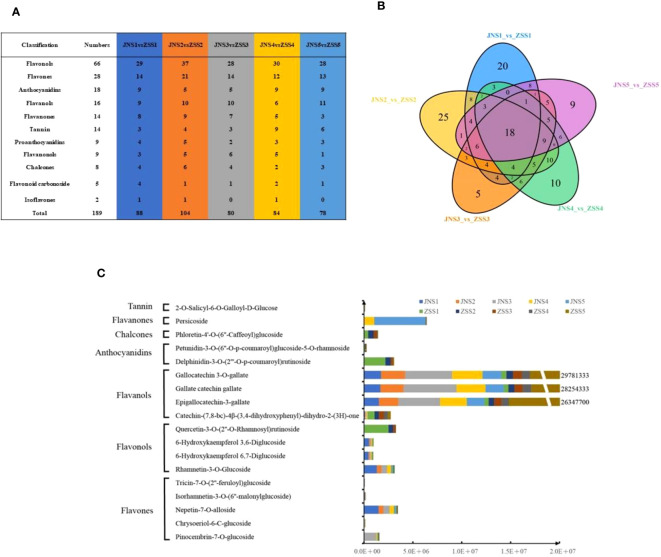
Figure 2.
Sampling and variance analysis of two apricot fruits at different fertility stages. (A) statistics of differentially accumulated metabolite types in different comparison groups; (B) Venn diagram of differentially accumulated metabolites; (C) relative contents of 18 differentially accumulated metabolites at different periods in JN and ZS.

