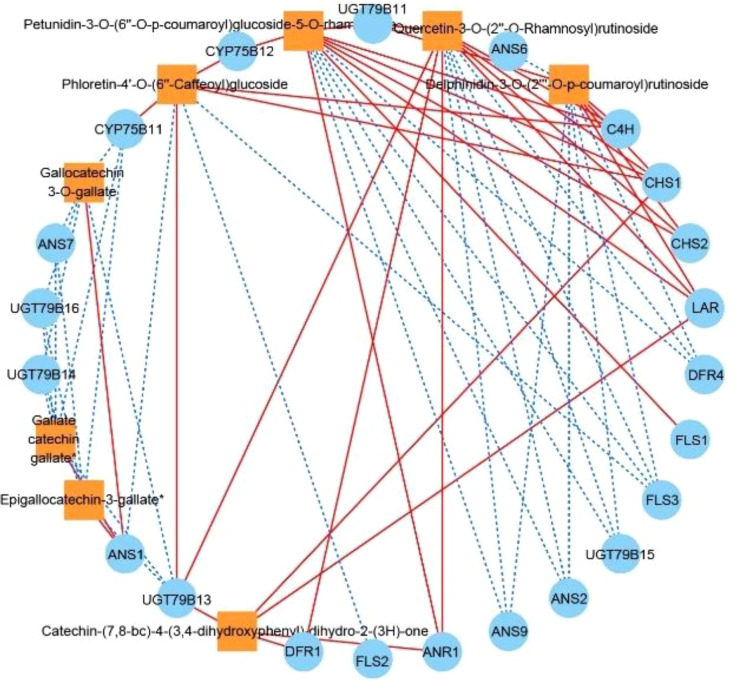
Figure 6.
Correlation network diagram of eight DAFs in ZS and key structural genes involved in flavonoid biosynthesis. Orange boxes represent DAFs, blue circles represent enzyme-encoding genes, red solid lines represent a positive correlation between the two, and blue dashed lines represent a negative correlation between the two.

