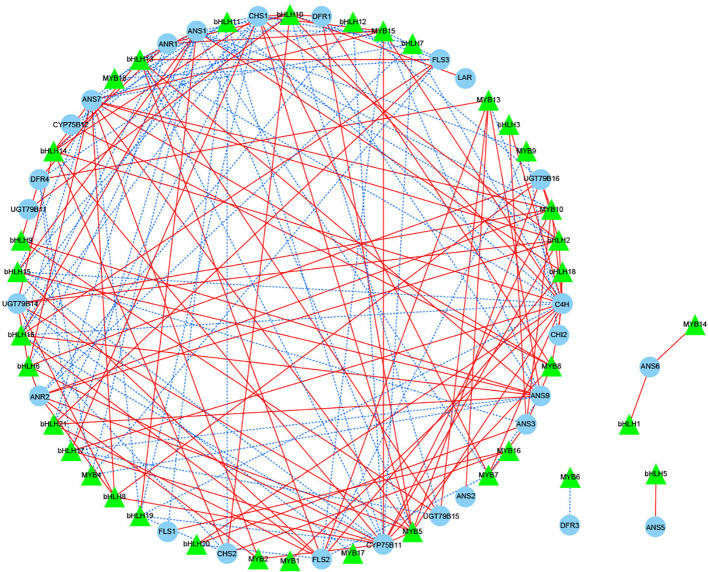
Figure 7.
Correlation network diagram of key structural genes involved in flavonoid biosynthesis with MYB and bHLH transcription factors. Green triangles represent transcription factors, blue circles represent key structural genes involved in flavonoid biosynthesis, red solid lines represent a positive correlation between the two, and blue dashed lines represent a negative correlation between the two.

