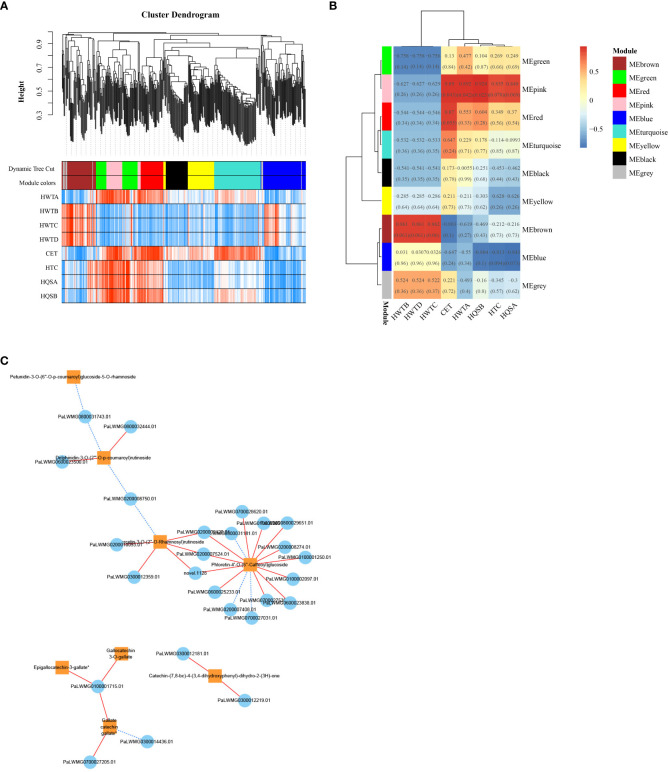
Figure 8.
ZS differentially expressed genes and WGCNA results for differentially accumulated metabolites. (A) clustering dendrogram results showing 9 expression modules, each marked with a different color; (B) 8 DAF correlation analysis modules in ‘ZS’, the value in each box indicates the Pearson correlation coefficient between the modules containing DAFs, and the number in each bracket indicates the P value. The color scale on the right side represents the correlation degree between the modules and DAFs, and the red color represents high correlation; (C) Correlation network diagram of DEGs and 8 DAFs. The orange box indicates DAFs, the blue circle indicates DEGs, the red solid line indicates positive regulation between the two, and the blue dashed line indicates negative regulation between the two.

