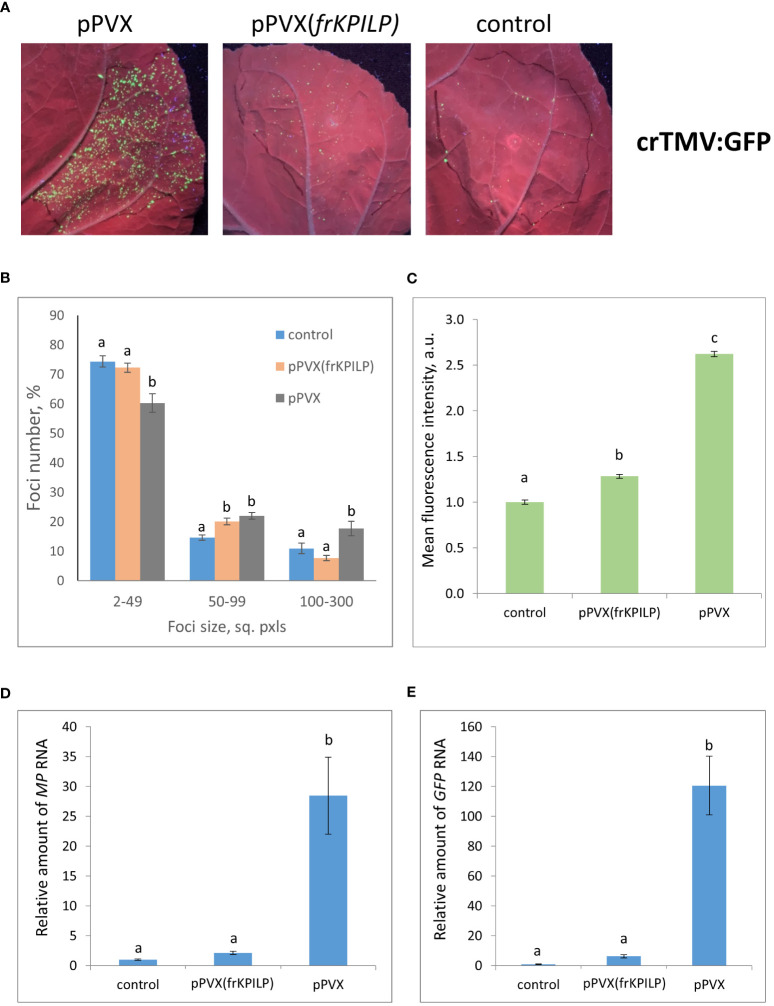
Figure 4.
Upregulation of KPILP expression stimulates crTMV:GFP reproduction and intercellular spread. (A) GFP-expressing foci visualization under UV light in N. benthamiana leaves of control (on the right) plants and plants with up- (on the left, pPVX) and downregulated [in the middle, pPVX(frKPILP)] KPILP expression 4 days after agroinfiltration with crTMV:GFP. (B) Percentage of crTMV:GFP-expressing foci of different size. (C) Mean GFP fluorescence intensity in analyzed foci. Relative amount of MP (D) and GFP (E) RNA in analyzed leaves quantified by qRT-PCR. Mean values and standard error are presented in histograms (B–E). The data was analyzed using ANOVA. Bars without similar letters indicate significant differences according to Tukey HSD at p<0.05.

