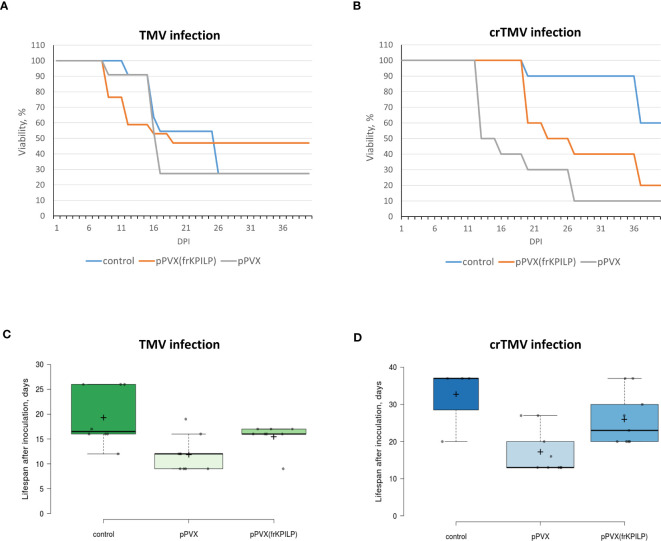
Figure 6.
KPILP silencing leads to higher resistance of N. benthamiana to tobamovirus infection. (A) The viability of plants infected with TMV. (B) The viability of plants infected with crTMV. (C) The lifespan of plants with up- and downregulated KPILP inoculated with TMV. (D) The lifespan of plants with up- and downregulated KPILP inoculated with crTMV. In boxplots (C, D) central lines show the medians, and box boundaries indicate the 25th and 75th percentiles as determined by R software, whiskers extend 1.5 times the interquartile range from the 25th and 75th percentiles, outliers are represented by dots, crosses represent sample means, and data points are plotted as circles.

