. 2023 May 15;29(15):2869–2884. doi: 10.1158/1078-0432.CCR-22-3567

Figure 4.

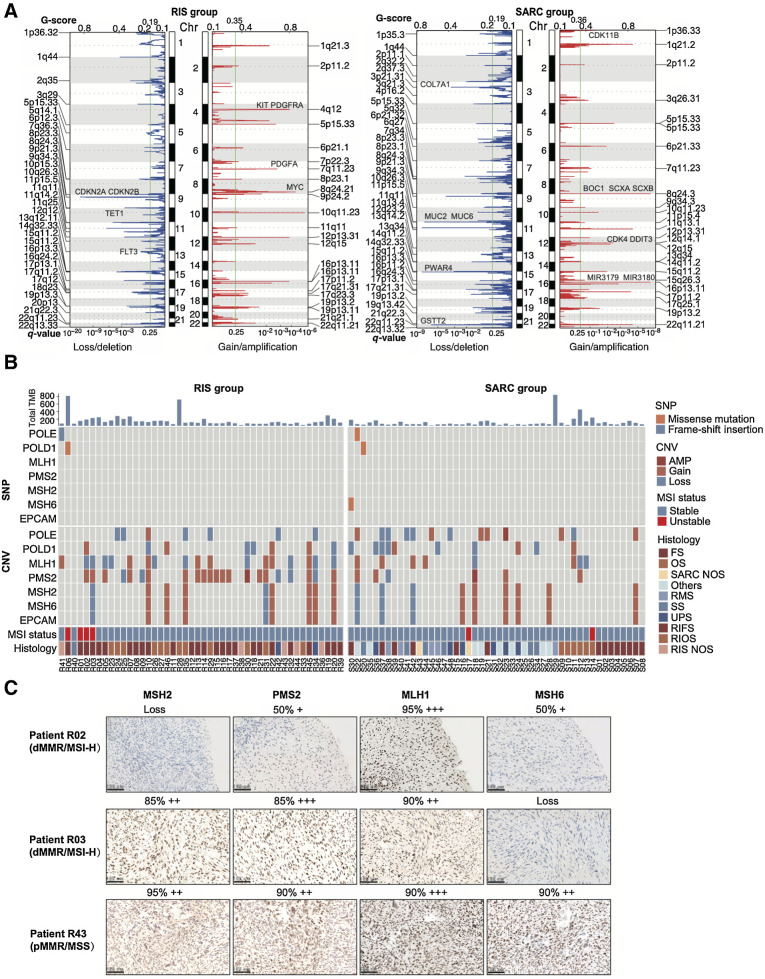
Figure 4. Genome instability and mutational signatures of RIS and primary sarcomas. A, Copy-number analysis of the RIS group and the SARC group. B, Bars showing TMB (top), heat maps summarizing alterations of POLE, POLD1, MLH1, PMS2, MSH2, MSH6, and EPCAM (middle) and predicted MSI status (bottom) in two groups. C, Representative images of IHC staining for MMR proteins in two MMR-deficient (dMMR)/MSI-H RIS and one MMR-proficient (pMMR)/MSS RIS.

Genome instability and mutational signatures of RIS and primary sarcomas. A, Copy-number analysis of the RIS group and the SARC group. B, Bars showing TMB (top), heat maps summarizing alterations of POLE, POLD1, MLH1, PMS2, MSH2, MSH6, and EPCAM (middle) and predicted MSI status (bottom) in two groups. C, Representative images of IHC staining for MMR proteins in two MMR-deficient (dMMR)/MSI-H RIS and one MMR-proficient (pMMR)/MSS RIS.