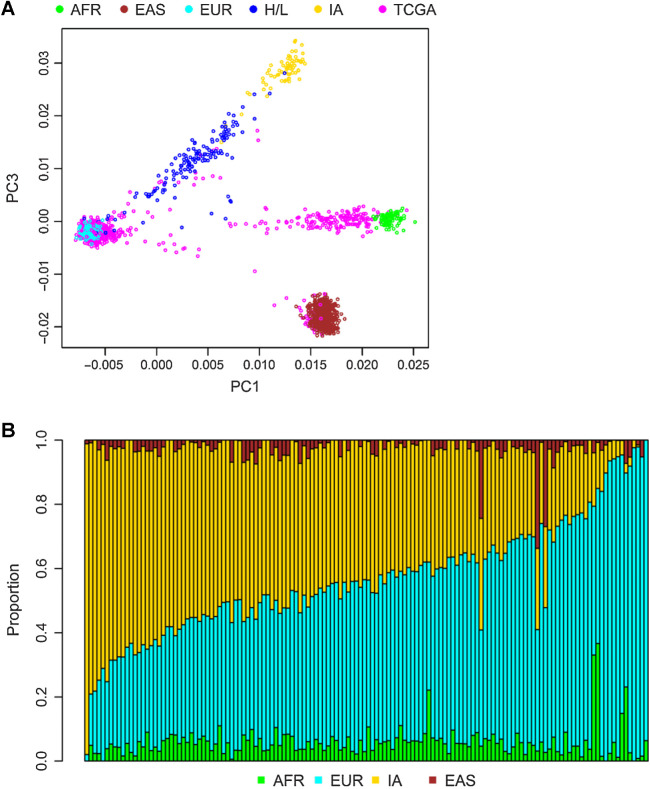
Figure 1.
Ancestry of the cohort. Results of principal components analysis comparing the values for samples on principal component (PC) 1 (x-axis) and PC3 (y-axis) (A). Each dot represents the results from one individual. H/L, dark blue; TCGA, pink; and reference populations including African (AFR), Yoruban individuals from Nigeria from HapMap (light green); East Asians (EAS), Han Chinese from HapMap (brown); European American (EUR) from HapMap (light blue); and IA (yellow) from Mexico. PC2 (not shown) captures individuals of Asian and IA ancestry. B, Results from ADMIXTURE analysis. Each vertical bar represents estimate of ancestry from one individual. Ancestry is assigned for each individual as a fraction of either African (green), Asian (brown), European (light blue), or IA (yellow) ancestry.

