. 2023 May 5;83(15):2600–2613. doi: 10.1158/0008-5472.CAN-22-2510

Figure 2.

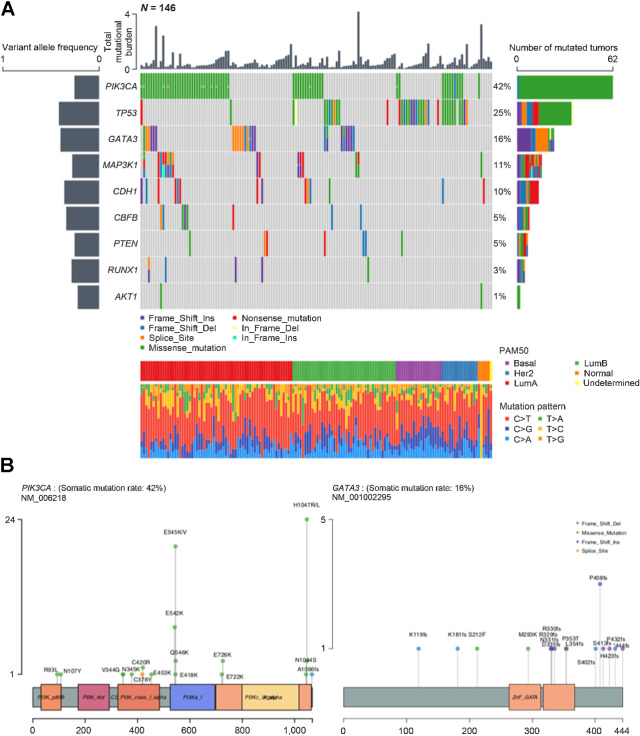
Figure 2. Tumor mutational burdens and somatic mutational profiles. A, Mutation plot of nine significantly mutated genes in the 146 tumors. Different mutation classifications are color coded. Numbers are shown where multiple mutations of the same classification were detected. Total mutational burden for each tumor is shown as a bar chart on top. The mean variant allelic frequency is shown for each gene on the left. PAM50 subtype and mutation pattern for each tumor are shown at the bottom. B, Lollipop plots of PIK3CA and GATA3 mutations within the 146 tumors. Mutation classifications are color coded and amino acid changes are specified for each mutation.

Tumor mutational burdens and somatic mutational profiles. A, Mutation plot of nine significantly mutated genes in the 146 tumors. Different mutation classifications are color coded. Numbers are shown where multiple mutations of the same classification were detected. Total mutational burden for each tumor is shown as a bar chart on top. The mean variant allelic frequency is shown for each gene on the left. PAM50 subtype and mutation pattern for each tumor are shown at the bottom. B, Lollipop plots of PIK3CA and GATA3 mutations within the 146 tumors. Mutation classifications are color coded and amino acid changes are specified for each mutation.