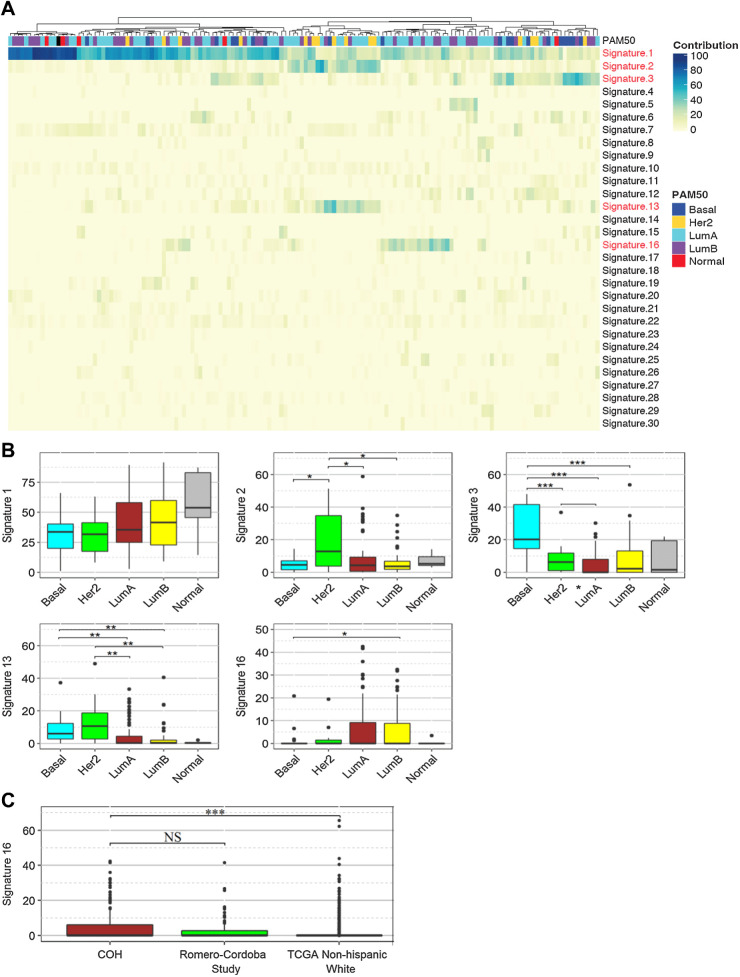
Figure 3.
Mutational signatures. A, Unsupervised clustered heatmap of contributions from each mutational signature for the 146 tumors. Significant signatures are highlighted in red. PAM50 subtype for each tumor is shown on top of the heatmap. B, Box plot comparisons of the contributions of the five significant mutational signatures (Signature 1, 2, 3, 13, 16) across the PAM50 subtypes. Statistical significance levels are indicated within the box plots. C, Box plot of signature 16 contributions in the 146 tumors from the Hispanic-Mexican cohort (COH), Romero-Cordoba study, and the non-Hispanic White tumors in TCGA dataset. Statistical significance levels are indicated within the box plot. NS, not significant, P > 0.05; *, P < 0.05; **, P < 0.01; ***, P < 0.001; Wilcoxon rank-sum test.

