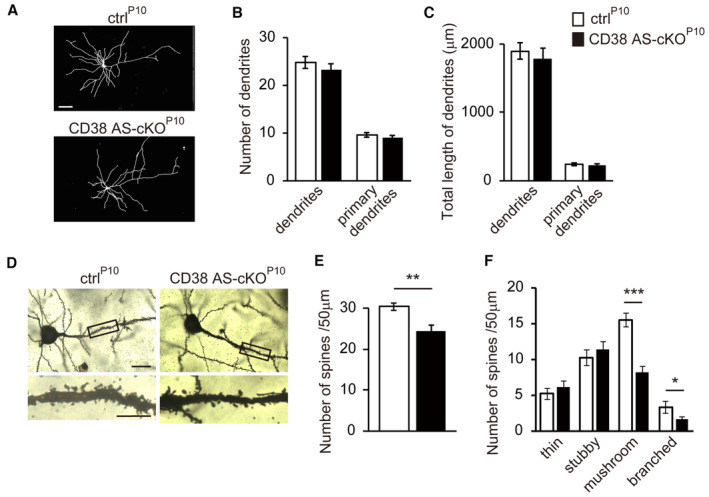
Figure 2. Spine morphology is altered in the mPFC pyramidal neurons in CD38 AS‐cKOP10 mice.

-
AImages of tracing of Golgi‐stained pyramidal neurons in the mPFC of ctrlP10 and CD38 AS‐cKOP10 mice at P70. Scale bar, 20 μm.
-
B, CQuantification of the total number (B) or total length (C) of dendrites and primary dendrites in ctrlP10 and CD38 AS‐cKOP10 mice (n = 24 cells from four animals per genotype, two‐way ANOVA followed by Bonferroni's multiple comparisons test).
-
DImages of Golgi‐stained pyramidal neurons in the mPFC of ctrlP10 and CD38 AS‐cKOP10 mice at P70. Scale bars, 20 μm (upper) and 5 μm (lower).
-
EQuantification of the total number of spines on the apical dendrites of the ctrlP10 and CD38 AS‐cKOP10 mice (n = 24 dendrites from four animals per genotype, two‐tailed unpaired Student's t‐test).
-
FThe percentage of branched, mushroom, stubby, and thin spines in cortical apical dendritic spines of the ctrlP10 and CD38 AS‐cKOP10 mice (n = 24 dendrites from four animals per genotype, two‐way ANOVA followed by Bonferroni's multiple comparisons test).
Data information: Data represent means ± SEM. *P < 0.05, **P < 0.01, ***P < 0.001.
