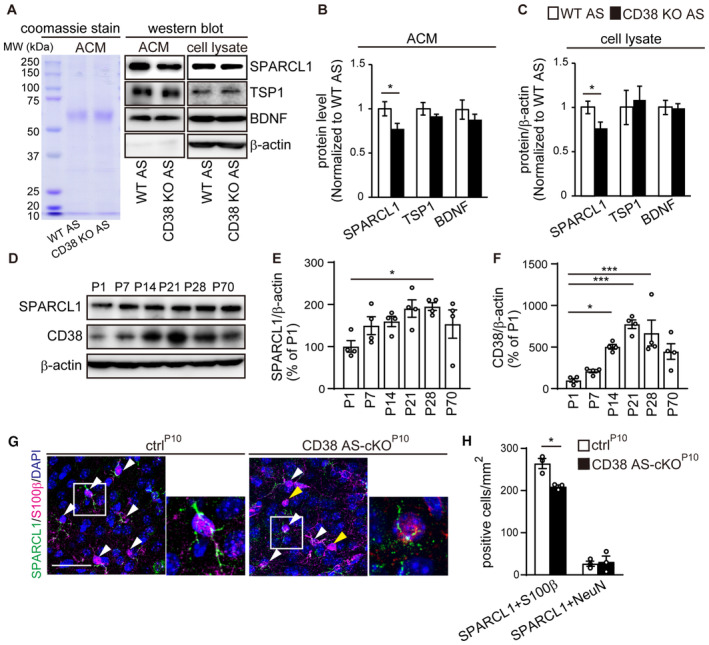
Figure 4. Astroglial CD38 regulates extracellular SPARCL1 level.

-
ACoomassie staining shows the total protein composition of ACM of WT and CD38 KO astrocytes. Representative western blot images of SPARCL1, TSP1, BDNF, and β‐actin protein expression in ACM and cell lysates derived from WT or CD38 KO astrocytes.
-
B, CSPARCL1, TSP1, and BDNF level in ACM and cell lysates derived from WT or CD38 KO astrocytes. Protein levels in ACM and lysates were normalized to total protein and the loading control β‐actin, respectively (n = 6 independent culture per condition from six animals, two‐tailed unpaired Student's t‐test).
-
DRepresentative western blot images of SPARCL1, CD38, and β‐actin protein expression in the postnatal mPFC of WT mice.
-
E, FRelative optical density of SPARCL1 and CD38 normalized to that of the loading control β‐actin (n = 4 animals, one‐way ANOVA followed by Tukey–Kramer test).
-
GImmunohistochemistry for SPARCL1 (green) and S100β (magenta) in the mPFC of ctrlP10 and CD38 AS‐cKOP10 mice at P21. White arrowheads indicate SPARCL1/S100β‐double positive cells. Yellow arrowheads indicate SPARCL1‐negative/S100β‐positive cells. Nuclei were counterstained with DAPI. Scale bar, 50 μm.
-
HQuantification of SPARCL1/S100β‐ or SPARCL1/NeuN‐double positive cells in the mPFC of ctrlP10 and CD38 AS‐cKOP10 mice at P21 (n = 3 animals per genotype, two‐tailed unpaired Student's t‐test).
Data information: Data represent means ± SEM. *P < 0.05, ***P < 0.001.
Source data are available online for this figure.
