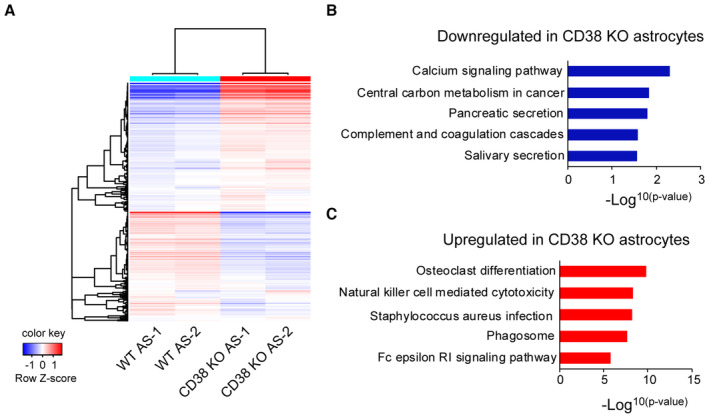
Figure 7. Transcriptome analyses reveals altered calcium signaling pathway in CD38 KO astrocytes.

-
AHeat maps of RNA‐seq data from WT and CD38 KO cultured astrocytes. Genes and samples were clustered using correlation distance with complete linkage.
-
B, CGraph depicting top ranked KEGG terms by gene ontology analysis of down‐ and upregulated genes (log2 fold change < −0.57 or > 0.57; FPKM > 3; FDR < 0.05) in CD38 KO astrocytes (n = 2 independent cultures from two animals per genotype). The significance of enrichment in KEGG pathway analyses was calculated using the P value function obtained from a modified Fisher's exact test using the DAVID database.
