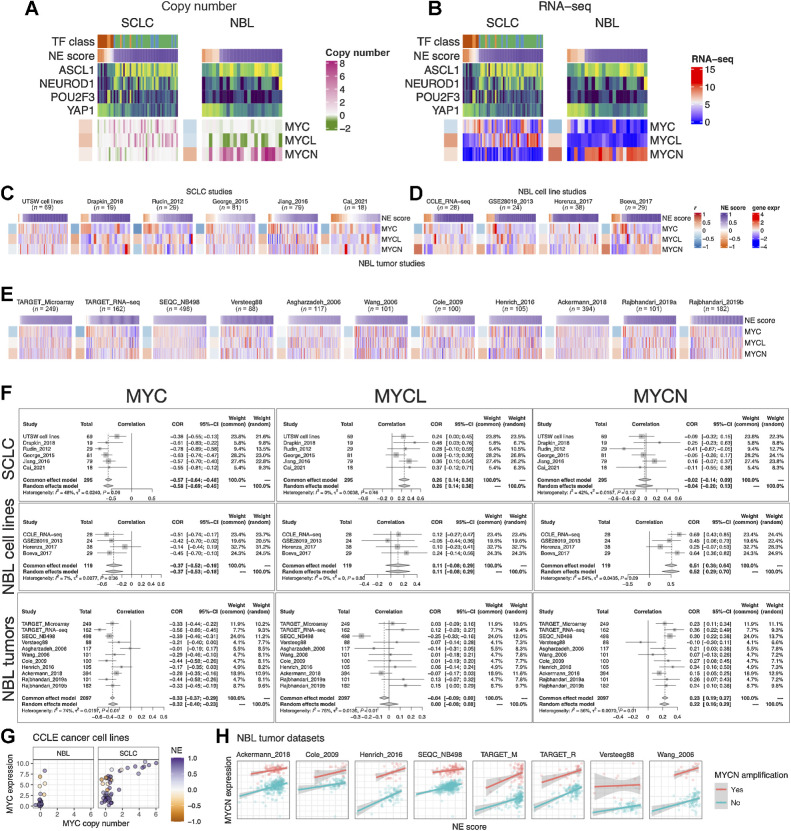
Figure 4.
NE score association with members of the Myc oncogene family in SCLC and neuroblastoma. Copy number (A) and RNA expression (B) of Myc family genes in SCLC and neuroblastoma cell lines. Note that although MYC amplification was higher in the high-NE-score SCLC cell lines, its gene expression was higher in the low-NE-score cell lines for both SCLC and neuroblastoma lines. Frequent MYCL loss was found in neuroblastoma because MYCL is located in a frequently deleted region (chromosome 1p) in neuroblastoma. C, NE score versus Myc gene member expression in SCLC studies. “UTSW cell line” is a cell line dataset; “Drapkin_2018” is a PDX dataset; “Rudin_2012,” “George_2015,” “Jiang_2016,” and “Cai_2021” are all patient tumor datasets. NE score versus Myc gene member expression in neuroblastoma cell line datasets (D) and tumor datasets (E). Note that some of the same cell lines were profiled in multiple studies. F, Forest plots visualizing meta-analysis of NE score association with Myc family genes. MYC expression is consistently associated with lower NE scores in SCLC and neuroblastoma samples (left). MYCL expression positively correlates with NE scores in SCLC but not neuroblastoma samples (middle). MYCN expression positively correlates with NE scores in neuroblastoma but not SCLC samples. G, Relationship between MYC copy number and gene expression in neuroblastoma and SCLC cell lines. Note that MYC amplification is only observed in SCLC cell lines. H,MYCN gene expression positively correlate with NE scores while controlling for MYCN amplification status in neuroblastoma patient tumors.

