. 2023 May 12;21(8):795–807. doi: 10.1158/1541-7786.MCR-23-0002

Figure 5.

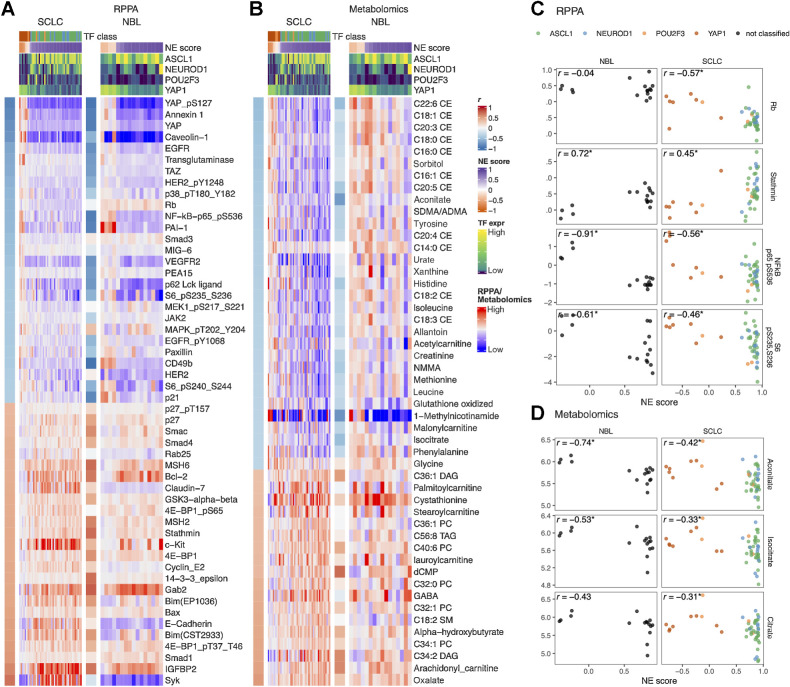
Figure 5. NE score–associated protein and metabolic features are largely consistent in SCLC and neuroblastoma cell lines. Heat maps visualizing the relationship between NE scores and selected functional proteomic feature (A) or metabolites (B). In each heat map, the left-side column denotes the Pearson correlation between the selected feature on the row and the NE score. The top colored rows denote NE scores and SCLC TF expression. The features were selected on the basis of NE score correlation from the SCLC cell lines, adjusted P value (P.adj) < 0.05 was used to select RPPA features and P.adj < 0.1 was used to select metabolic features. Note that although the selection was made from SCLC cell lines, a very similar pattern could be observed in neuroblastoma cell lines. Scatterplots visualizing the relationship between selected RPPA (C) and metabolic (D) features and NE scores in neuroblastoma and SCLC cell lines.

NE score–associated protein and metabolic features are largely consistent in SCLC and neuroblastoma cell lines. Heat maps visualizing the relationship between NE scores and selected functional proteomic feature (A) or metabolites (B). In each heat map, the left-side column denotes the Pearson correlation between the selected feature on the row and the NE score. The top colored rows denote NE scores and SCLC TF expression. The features were selected on the basis of NE score correlation from the SCLC cell lines, adjusted P value (P.adj) < 0.05 was used to select RPPA features and P.adj < 0.1 was used to select metabolic features. Note that although the selection was made from SCLC cell lines, a very similar pattern could be observed in neuroblastoma cell lines. Scatterplots visualizing the relationship between selected RPPA (C) and metabolic (D) features and NE scores in neuroblastoma and SCLC cell lines.