Figure 6.
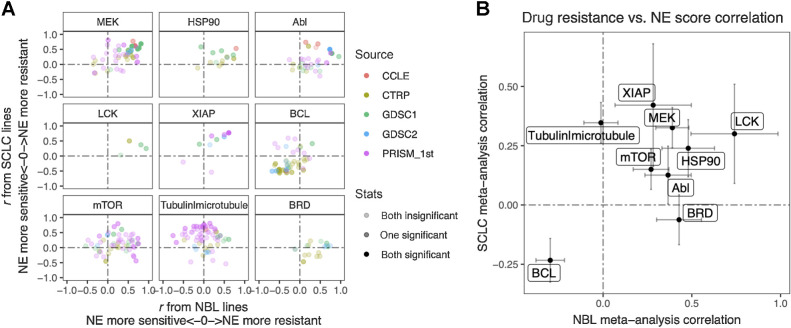
Similar and distinct NE score–associated therapeutic sensitivity in SCLC and neuroblastoma cell lines. A, Correlation between NE scores and therapeutic sensitivity for drugs with selected targets. Therapeutic sensitivity data were previously harmonized such that a higher value represents more resistance in each study. For each of the nine selected targets, all compounds with the same target were identified from multiple studies. Pearson correlation coefficient r from correlating compound data with NE scores were calculated for neuroblastoma lines (x-axis values) and SCLC lines (y-axis values), respectively and visualized as a scatter plot, with colors annotating the source of data, and transparency annotating the statistical significance. B, Meta-analysis–summarized correlation between drug therapeutic sensitivity and NE scores in neuroblastoma (x-axis) and SCLC (y-axis) cell lines. Note that high NE scores are associated with resistance to inhibitors of LCK, MEK, XIAP, mTOR, HSP90, and Abl, and sensitivity to BCL inhibitors. NE scores are associated with resistance to BRD inhibitors in neuroblastoma but not SCLC whereas microtubule inhibitors resistance correlates with high NE scores in SCLC but not neuroblastoma cell lines.

