Figure 1.
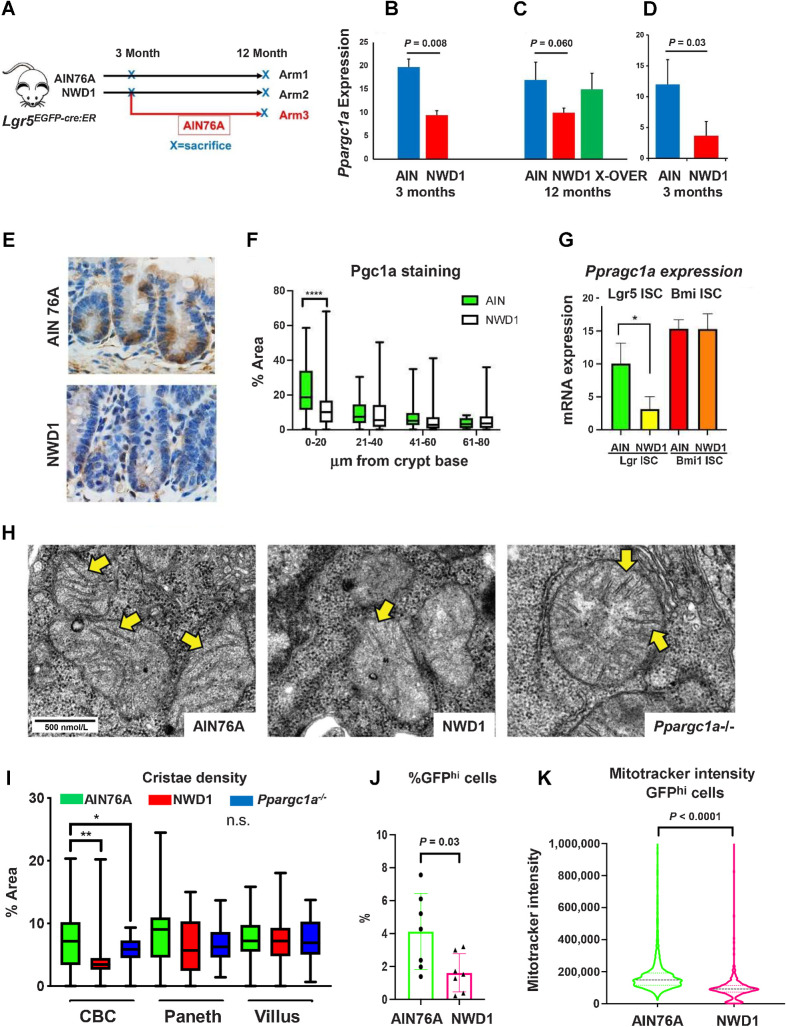
Dietary impact on ISCs: A,Lgr5EGFP.cre:ER mice fed AIN76A or NWD1 for 3 or 12 months from weaning, or NWD1 for 3 months then switched to AIN76A for 9 months (cross-over); B–D,Ppargc1a expression by bulk RNA-seq of Lgr5hi cells of two different mouse cohorts fed either NWD1 or AIN76A for 3 months from weaning (B and D), or for NWD1 or AIN76 for 12 months compared with NWD1 for 3 months and then switched to AIN76A for an additional 9 months (C - Arm 3, A). N-3 mice for each group for each cohort. E and F, Pgc1a IHC and quantitation in crypts of mice fed AIN76A or NWD1 for 3 months. N = 3 mice for each group. G,Ppargc1a expression in Lgr5hi and Bmi1+ cells from bulk RNA-seq analysis of mice fed different diets for 3 months. N = 3 mice for each group. H, Examples of mitochondria in WT mice fed AIN76A or NWD1, or mice fed AIN76A and Ppargc1a homozygously inactivated in Lgr5 cells (800X – yellow arrows indicate examples of cristae). I, Quantitation of mitochondrial cristae density in CBC, Paneth, and villus cells, evaluated at 5,000X magnification. N = 3 mice for each group. J, FACs analysis of Lgr5hi cell number. N = 7 mice for each diet group. K, Mitotracker staining of mice fed AIN76A or NWD1 for 3 months. (*, P < 0.05; **, 0.01; ***, 0.001). N = 7 mice for each group. B, C, D, G, and J, Mean ± SD. F and I, Box and whiskers plot. K, Median ± quartiles.

