Figure 2.
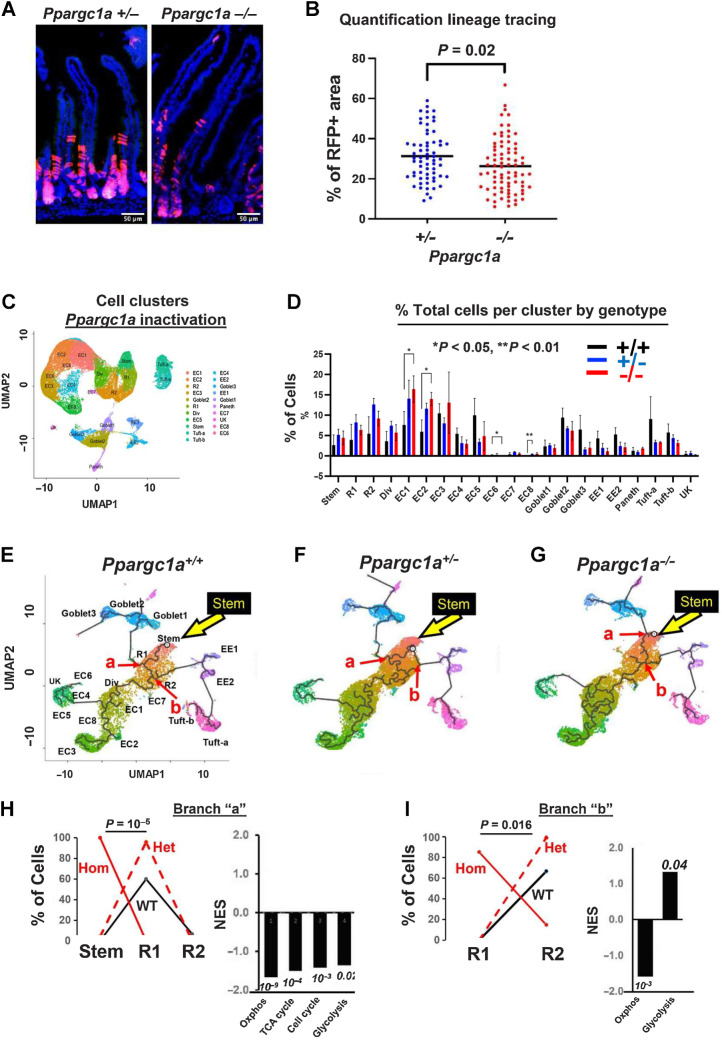
Genetic inactivation of Ppargc1a in Lgr5 cells: A, Suppressed lineage tracing from Lgr5hi cells by homozygous inactivation of Ppargc1a in Lgr5cre:er-GFP, Ppargc1aF/+ or −/−, Rosa26tom mice fed AIN76A diet, 3 days after a single TAM injection. B, Quantification of lineage tracing. N = 2 mice for each genetic group. C, Cluster map and cell types (nine scRNA-seq libraries). D, Epithelial cell distribution in clusters/lineages in WT mice or with heterozygous or homozygous Ppargc1a inactivation targeted to Lgr5hi cells; shown are stem cells, Replicating cells (R1, R2), Dividing cells (Div), multiple enterocyte populations (EC), Goblet, Enteroendocrine (EE1, EE2), Paneth and Tuft cells and a minor unknown population that could not be aligned with markers (UK). E–G, Trajectory analysis from scRNA-seq of total intestinal epithelial cells from WT mice or 3 days after heterozygous or homozygous Ppargc1a inactivation: yellow arrow, Stem cell cluster; abbreviations as in C and D. H and I, Cell type distribution at branch point “a” and “b”, respectively (red arrows in E–G) of WT, het and hom inactivation of Ppragc1a and GSEA of pathways of Ppargc1a−/− compared with WT mice at those branch points (numbers are P values). For C–I,N = 3 mice for each genetic group.

