. 2023 Apr 25;21(8):808–824. doi: 10.1158/1541-7786.MCR-22-1000

Figure 5.

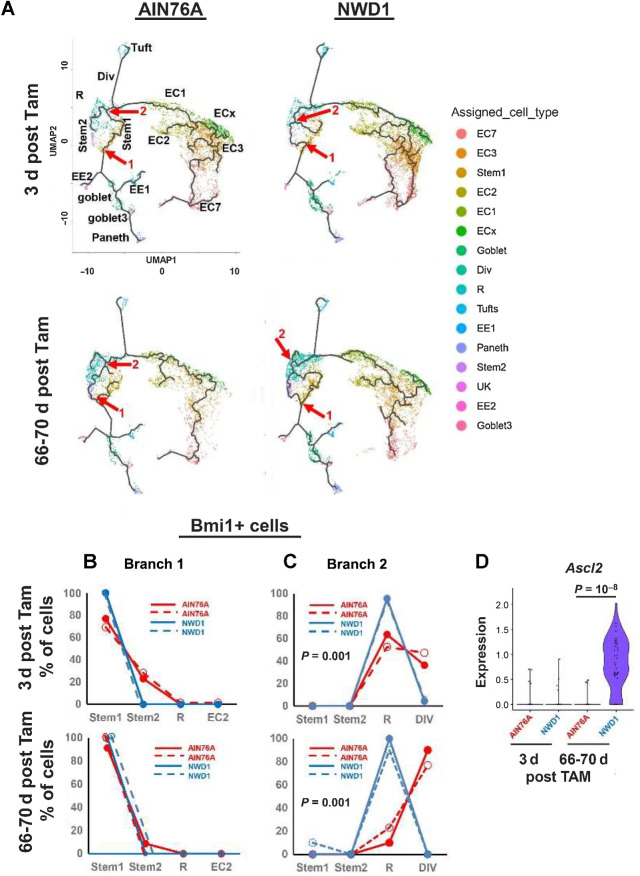
Figure 5. A, Trajectory analysis of Bmi1+ marked cells at 3 or 66–70 days after Tam activation of the Bmi1 marker, annotated with individual cell types: red arrows/numbers denote branch points analyzed. Cell types identified are stem cells, Replicating cells (R1, R2), Dividing cells (Div), multiple enterocyte populations (EC), Goblet, Enteroendocrine cells (EE1, EE2), Tuft and Paneth cells. B and C, Cell type distribution at branch points “1” and “2” (red arrows in A), D, Ascl2 expression per cell at branch point 2. For each of the four diet-timepoint groups analyzed in A–D, N = 2 mice per group.

A, Trajectory analysis of Bmi1+ marked cells at 3 or 66–70 days after Tam activation of the Bmi1 marker, annotated with individual cell types: red arrows/numbers denote branch points analyzed. Cell types identified are stem cells, Replicating cells (R1, R2), Dividing cells (Div), multiple enterocyte populations (EC), Goblet, Enteroendocrine cells (EE1, EE2), Tuft and Paneth cells. B and C, Cell type distribution at branch points “1” and “2” (red arrows in A), D,Ascl2 expression per cell at branch point 2. For each of the four diet-timepoint groups analyzed in A–D,N = 2 mice per group.